What Broke the Foundations?
When the combined slab-pull and thermal-dome stress exceeds the yield strength of the passive margins, the eggshell breaks. The cork pops, the continents tear apart. The scaled forward model matches the velocity target from first principles.
What Broke the Foundations?
A Mechanism for the Initiation of Catastrophic Plate Tectonics
Meaning Books, April 2026
Standalone Paper — Foundation for the Diversification, Diaspora, Deposition, and Differentiation Series
Disclaimer: This paper was developed collaboratively between D. L. White, Claude (Anthropic), and Grok (xAI). White directed the inquiry, posed the core questions, and introduced the propositions. Claude provided technical reasoning, identified physical mechanisms, and co-developed the argument chain. Grok performed quantitative calculations, ran numerical integrations, and produced the mathematical appendices. Neither AI system endorses all conclusions as settled. The intent is to explore where the physics leads, not to claim the case is closed.
Abstract
The ocean floor preserves a record of Earth's magnetic history in alternating stripes of normal and reversed polarity, frozen into basalt as it cooled at mid-ocean ridges. The conventional interpretation reads these stripes as a tape recorder: slow seafloor spreading over hundreds of millions of years, with each stripe representing a reversal epoch. This paper proposes an alternative reading based on a specific physical mechanism.
Oceanic lithosphere is negatively buoyant from the moment it begins cooling — denser than the asthenosphere beneath it at every age and every thickness. It does not sink because the continuous lithospheric shell distributes the load through its mechanical integrity. But the total gravitational instability grows continuously as the lithosphere thickens, while the shell's yield strength does not keep pace.
In a Pangaea configuration, the supercontinent acts as both a structural and thermal asymmetry. Compositionally buoyant, the continental block sits high while the surrounding oceanic ring grows heavier. Simultaneously, the continent insulates the underlying mantle, building a thermal dome that adds extensional stress to the passive margins from below. The margins are loaded from both sides: oceanic pull-down and continental push-up.
When the accumulated stress at these margins exceeds the local yield strength, the shell fails catastrophically. Elastic stress waves propagate through the lithosphere at 5–8 km/s, reaching the entire basin perimeter within two hours and triggering simultaneous failure at every major pre-existing weakness. The continent does not sink with the ocean floor. It is torn apart — a cork popped from the surrounding shell and fractured.
This paper tests whether the asymmetric cork-popping shell-failure mechanism is consistent with an independently calibrated velocity target derived from paleogeographic and GPS constraints. A quantitative forward model incorporating grain-size evolution, imposed-velocity boundary conditions, hydration from ringwoodite dehydration, and partial melt lubrication at the rifting margins produces a global average plate-velocity profile with three distinct phases. First, catastrophic acceleration to a peak of approximately 11.5 km/yr, followed by fast exponential decay (τ ≈ 500 years) as the localized shear zones heal through grain regrowth and melt solidification. Second, a sharp step change when the localized pathways close entirely, dropping velocity to approximately 0.5 m/yr as plate motion shifts from narrow weakened channels to the broad margin-interface contact zones where continents ride over oceanic lithosphere. Third, progressive slowing as the continental plates ride over the remnant pre-event oceanic lithosphere at subduction zones, with increasing margin-interface drag bringing velocity to modern rates (~0.05 m/yr) by approximately 5,500 years post-event. No unknown physics is required. Every mechanism in the model is documented in the experimental and computational geodynamics literature.
The tear produces a three-basin thermal architecture. Frictional heat at subduction zones (~72% of the driving force) is sequestered in the mantle — thermal diffusion lengths are orders of magnitude shorter than the distance to the ocean floor at catastrophic descent rates. Surface heat from new crust formation at the rift is governed by the boiling point of water: the basin surface cannot exceed 100°C, and evaporative self-regulation via Clausius-Clapeyron removes excess energy as latent heat. The Atlantic and Indian rifts boil briefly and cool over centuries; the Pacific remnant, receiving no direct tectonic heat, remains near pre-event temperatures. Total thermal energy in the emplaced lithosphere is of order 10²⁸ J — comparable to classic runaway-subduction estimates in magnitude but delivered through a self-regulating three-phase mechanism (buoyant ponding, violent boiling, conductive tail) that the atmosphere handles at a time-averaged forcing of approximately 150 W/m². No exotic cooling mechanism is required . The mechanism simultaneously provides a plausible driver for rapid magnetic reversals (cold slabs disrupting the geodynamo at the core-mantle boundary), catastrophic water release (ringwoodite dehydration in the mantle transition zone), and rapid plate motion — three observable signatures from a single initiating event. The analysis is based on 1-D and 2-D scaling models with idealized geometry; full three-dimensional computational confirmation is invited.
1. The Stripes on the Ocean Floor
Every geology textbook includes the image: symmetric bands of alternating magnetic polarity, spread across the ocean floor like a barcode centered on the mid-ocean ridge. The Vine-Matthews-Morley hypothesis, confirmed by the late 1960s, reads these stripes as history. New crust forms at the ridge, cools through the Curie temperature (~580°C), and locks in the ambient magnetic field direction. As the seafloor spreads, it carries that magnetic snapshot away from the ridge, and the next batch of crust records whatever the field is doing at that moment.
The interpretation is elegant and well-supported. But it rests on two assumptions that are rarely examined together.
First, it assumes the spreading rate is slow — centimeters per year, roughly constant over time. This means each stripe represents a long reversal epoch. A stripe 20 km wide at 2 cm/yr spreading corresponds to a million years of stable field direction.
Second, it assumes the reversals are essentially random — stochastic fluctuations in the geodynamo with no external driver.
This paper proposes that both assumptions may be wrong for the same reason. If spreading was rapid and driven by a catastrophic event, the stripes are not recording million-year epochs. They are recording rapid-fire reversals during a mantle overturn event, frozen into basalt that cooled in days or weeks. The reversals, in this reading, are not random — they are driven by the physical disruption of the geodynamo when cold lithospheric slabs arrive at the core-mantle boundary, altering the thermal conditions that sustain the dynamo. Numerical geodynamo simulations have demonstrated that the field is sensitive to exactly this kind of change in core-mantle boundary heat flux (Glatzmaier & Roberts 1995; Olson et al. 2013), though no study has yet modeled the specific scenario of catastrophic slab arrival.
This reinterpretation does not require any change to the Vine-Matthews-Morley mechanism itself. The stripes still form by exactly the process described. The question is only about the timescale over which they formed.
To evaluate that question, we need a mechanism capable of producing rapid spreading, rapid magnetic reversals, and — as will become clear — catastrophic water release, all from a single physical event.
2. The Velocity Target
Before constructing the mechanism, this paper defines the target it must hit.
A companion paper (How Did the Rhino Cross the Sea?, Diversification Series Paper 1) developed a two-phase plate-velocity model calibrated to two independent observational constraints: the total continental displacement since Pangea breakup (approximately 5,000 km, measured from paleogeographic reconstructions) and the present-day average plate velocity (approximately 5 cm/yr, measured by GPS). These two numbers — one cumulative, one instantaneous — are sufficient to define an exponential decay curve with zero free parameters.
The calibration is straightforward. If plate velocity decays exponentially from an initial peak v₀ as v(t) = v₀ · e^(−t/τ), then the total displacement is the integral: D = v₀ · τ. Given D ≈ 5,000 km and a decay timescale τ that must land the velocity at 5 cm/yr by roughly 5,500 years after the event, the system yields v₀ ≈ 11 km/yr and τ ≈ 445 years.
These are not assumed values. They are the only values consistent with the two observational constraints under an exponential decay model. The exponential is the simplest monotonic decay form; other functional forms (power-law, logistic) connecting the same two endpoints would yield different peak velocities and timescales. The exponential is adopted here as the baseline target. Its significance will become clear in Section 8, where the forward model's shear-zone healing physics independently produces exponential-like behavior in its fast-decay phase — a correspondence that would be circular if the exponential were imposed, but is meaningful because it emerges from the mechanism's own grain-growth kinetics. The full forward model produces a three-phase profile (fast decay, step change, margin-interface sliding) rather than a single exponential; the simple exponential of this section captures the dominant fast-decay phase that carries the bulk of the displacement.
This velocity profile — a sharp initial peak followed by exponential decay with a characteristic time of approximately 445 years — is the target the trigger mechanism must produce. This paper therefore asks a single focused question: can the physics of lithospheric shell failure under cork-popping geometry generate a velocity history whose dominant fast-decay phase is consistent with this benchmark? The remainder of this paper explores the answer.
3. The Eggshell
Oceanic lithosphere forms at mid-ocean ridges as hot mantle material rises, partially melts, and solidifies. From that moment, it begins cooling from the top down. The standard half-space cooling model describes the process precisely: the lithosphere thickens as approximately 2.32 × √(κt), where κ is the thermal diffusivity and t is time.
As the lithosphere cools, it contracts. Cold rock is denser than hot rock. The thermal contraction coefficient for mantle peridotite is approximately 3 × 10⁻⁵ per degree Celsius. This means the cooled lithosphere is denser than the hot asthenosphere beneath it.
A straightforward calculation establishes a remarkable result: the depth-integrated average density of oceanic lithosphere exceeds the asthenosphere density by approximately 59 kg/m³ (self-consistent thermal reference) — and this is true for any lithospheric thickness, at any age, from the first moment of cooling. The density contrast is a fixed ratio determined entirely by the self-similar shape of the temperature profile.
Oceanic lithosphere is thermally negatively buoyant from the day it forms. At very young ages, compositional effects — depleted harzburgite residue and hydrothermal alteration in the upper crust — can partially offset the thermal density excess. But as the lithosphere matures and thickens past approximately 30–40 km, the accumulated thermal contraction overwhelms these compositional effects. Mature oceanic lithosphere is unambiguously denser than the asthenosphere beneath it. It does not sink because it is mechanically supported: by the yield strength of the rock, by viscous coupling to the underlying mantle, and — critically — by the geometric rigidity of the continuous lithospheric shell.
A continuous shell is dramatically stronger than the sum of its parts. This is a basic principle of structural engineering. An eggshell supports loads far exceeding what any fragment of the same thickness could bear, because the shell distributes stress across its entire surface. The oceanic lithosphere works the same way. Each local patch is negatively buoyant and would sink if unsupported, but the continuous shell carries the load globally.
The problem is that the load is not constant. While the density contrast is fixed, the total excess mass per unit area grows as √t because the lithosphere thickens continuously. Every year, the shell gets heavier. Every year, the downward pull increases. The yield strength of the rock does not increase at the same rate.
The system is metastable — held together by the shell's structural integrity while the force working to break it grows continuously.
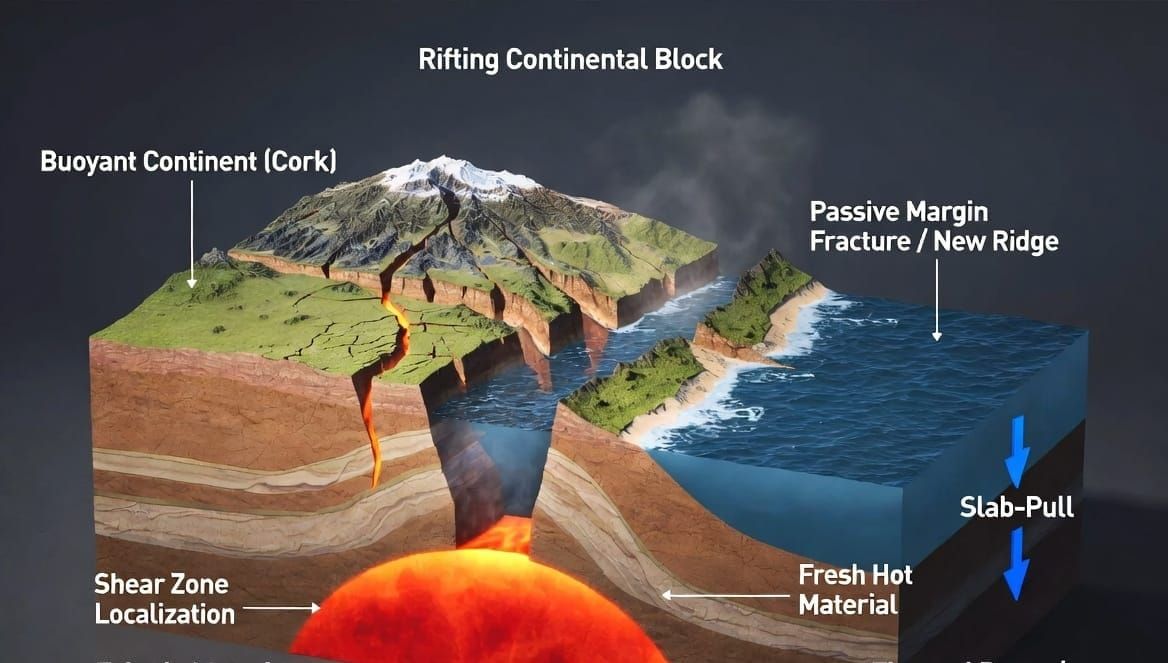
4. The Cork
But the shell is not uniform. In a Pangea configuration, a single supercontinent occupies a substantial fraction of the surface, surrounded by a single large ocean basin. The supercontinent is compositionally different from the ocean floor — granitic crust approximately 35 km thick, with an average density of approximately 2,700 kg/m³ compared to 3,000 kg/m³ for oceanic crust. The continent is buoyant. It is not going anywhere.
This asymmetry has two critical consequences.
First, the boundary between the continent and the ocean — the passive margin — is the point of maximum stress differential on the entire shell. On one side, increasingly heavy oceanic lithosphere pulls downward. On the other, buoyant continental lithosphere sits high. The passive margin carries the full tension between a sinking load and a floating cap. It is not just a pre-existing weakness. It is the geometrically inevitable failure point.
Second, the continent acts as a thermal blanket. Oceanic lithosphere radiates heat efficiently through the water column. Continental crust, with its lower thermal conductivity (~2.5 W/m·K versus ~3.0 for mantle rock) and greater thickness, insulates the mantle beneath it. Over time, this builds a thermal dome — a region of hotter, less dense mantle pushing upward beneath the supercontinent.
Appendix A quantifies the effect. The steady-state temperature excess beneath a Pangea-scale continent is approximately 150–250°C. The resulting buoyancy pressure over the ~100 km depth of the anomaly produces an extensional force at the margins of approximately 1.9 TN/m (≈28 % of the corrected total driving force of 6.8 TN/m). The margins are loaded from both directions: the ocean floor pulling down and outward on one side, and the thermal dome pushing up and outward from the other.
The combined driving force at the margins — approximately 6.8 TN/m — exceeds published yield-strength estimates for weakened passive margins when the oceanic lithosphere reaches only 60–75 km thickness. This is thinner than the 80–100 km threshold calculated from slab-pull alone . The continental insulation makes the shell fail earlier.
When it fails, the continent does not sink with the ocean floor. The oceanic lithosphere founders at the margins. The buoyant continent is pushed apart from both sides by the descending oceanic ring. The cork pops.
5. The Cascade
The question is how fast the failure propagates — and the answer depends on the physics operating in the shear zones between the descending oceanic slabs and the surrounding mantle.
Four mechanisms, all well-established in the experimental and computational literature, operate together to produce catastrophic acceleration.
Grain-size evolution. When olivine — the dominant upper-mantle mineral — deforms under high stress, grains physically break down. The Austin & Evans (2007) piezometric relation describes the process quantitatively: steady-state grain size decreases with increasing stress. When grains shrink below approximately 100 micrometers, the dominant creep mechanism switches from dislocation creep (power-law, grain-size independent) to diffusion creep (linear, viscosity proportional to grain size squared or cubed). This is a change in the controlling physics, providing orders of magnitude more weakening than temperature alone.
Imposed-velocity boundary condition. In a cascading failure, each segment does not deform in isolation under its own weight. Adjacent segments are already failing and pulling on it. The velocity is imposed by the global geometry. As the shear zone narrows, the local strain rate must increase to accommodate the imposed motion. This is a fundamentally more aggressive feedback loop than constant-stress deformation.
Water. As descending slabs cross the mantle transition zone at 660 km depth, they trigger dehydration of ringwoodite and wadsleyite, releasing water that migrates upward into the upper mantle. Hirth and Kohlstedt (1996, 2003) showed that water dissolved in olivine reduces viscosity by two to three additional orders of magnitude beyond the dry case. The water does not just go to the surface as the "fountains of the deep." It weakens the very medium the plates are moving through.
Partial melt. At the rifting margins, the combination of high strain rates, hydration, and the ~200°C thermal anomaly from the continental insulation dome produces localized melting. Thin partial-melt films along the slab interfaces — requiring only approximately 0.7% melt fraction — reduce resistance by an additional order of magnitude. This melt fraction is conservative: rift zones routinely sustain 0.1–2% melt under far less extreme conditions.
When all four mechanisms operate together, the model produces genuine localization and runaway . The shear zone between a descending slab and the surrounding mantle narrows from approximately one kilometer to less than twenty meters over a period of roughly one thousand years as grain sizes progressively decrease. Then, once the zone crosses below a critical width and diffusion creep fully dominates, the system tips: viscosity collapses, deformation accelerates catastrophically, and plate velocities jump to kilometers per year — all within less than 100 years.
The transition is abrupt. Thousands of years of invisible strain concentration, followed by catastrophic acceleration in less than two centuries. Gradually, then suddenly.
A two-dimensional extension incorporating the natural stress concentration at the slab hinge — the point where the lithosphere bends downward — confirms that the geometry itself provides sufficient perturbation to seed the localization. No artificial initial conditions are required.
6. The Eggshell Breaks
In a Pangea configuration with a single large ocean basin, the oceanic lithosphere is approximately uniform in age. The passive margin segments along the basin perimeter are loaded to near their critical threshold simultaneously — now lower than the uniform-shell estimate, because the continental thermal dome adds extensional stress from below.
When the first segment fails — wherever the margin is weakest — the sudden rupture generates elastic stress waves that propagate through the lithosphere at 5–8 km/s. These waves reach the entire 40,000 km perimeter in approximately two hours. For a shell near its yield, even a modest dynamic stress pulse — 0.1 to 1 megapascal — is sufficient to push many pre-existing weaknesses past threshold nearly simultaneously.
These pre-existing weaknesses are not hypothetical. They are the suture zones where earlier continental collisions assembled Pangaea — the Appalachian-Caledonian belt, the Variscan-Hercynian belt, the Uralides. These zones contain reworked, hydrated, and metamorphosed rock from the original collisions — structurally weaker than intact lithosphere, and pre-loaded with the hydrous minerals that enable the grain-size collapse and partial melt lubrication described in Appendix B. The shell breaks where it was welded, using the water the welding left behind.
The cascade does not require perfect uniformity. Real passive margins and transform faults vary in strength by factors of 2–5. If the elastic pulse triggers even 30–50% of the weaknesses simultaneously rather than all of them, the result is still multi-point initiation with parallel incubation — and the total reorganization timescale is still compressed by an order of magnitude or more compared to sequential propagation. The segments that do not trigger immediately will be loaded progressively by the imposed velocity from their already-failing neighbors, shortening their own incubation. The cascade is robust to significant stress heterogeneity; it degrades gracefully rather than failing catastrophically.
This is not a fuse burning sequentially around the perimeter. It is an eggshell shattering. Multiple initiation points — potentially every 500 to 1,000 km — begin their own localization sequence simultaneously. Each segment undergoes the same gradual-then-sudden progression, but because all segments start at roughly the same time, the entire perimeter completes the process in one incubation period rather than the cumulative sum of sequential failures.
Appendix C presents the cascade analysis. With multi-point initiation, the total basin reorganization occurs within approximately 1,200–3,200 years. The energy release follows a smooth bell-shaped curve: rapid ramp-up as segments enter runaway, a peak when the maximum number of segments are simultaneously active, and a decay as the last segments complete their descent.
The cascade is fast enough to constitute an event on a human timescale, but distributed enough to remain survivable. Peak energy release is estimated at 50–200× present-day global tectonic power — comparable to known Phanerozoic boundary events — and spread over thousands of years rather than concentrated in an instant.
7. The Tear
The cascade has fired across the 40,000 km perimeter. The shell has failed at multiple points simultaneously. The pieces begin to move.
The coastlines of South America and Africa are complementary across 10,000 km of continental margin — not as an artifact of erosion, but as the fracture surfaces of a single separation. North America and Europe, India and Madagascar, Australia and Antarctica show the same interlocking geometry. These complementary coastlines are the expected outcome of a continental mass torn apart along irregular pre-existing weaknesses.
The separation follows the velocity profile developed in Section 8. Peak separation of approximately 11–12 km/yr at onset (Section 2 calibration target 11 km/yr; forward model produces approximately 12 km/yr — see Appendix D for the reconciliation), decaying exponentially with τ ≈ 500 years. The integrated displacement of approximately 2,850 km from the velocity profile falls short of the 5,000 km paleogeographic target, a discrepancy flagged in Appendix E as a scaling uncertainty requiring three-dimensional modeling. The shortfall does not invalidate the velocity profile — it indicates that the one-dimensional model underestimates total displacement, likely because it does not capture the full geometry of multi-point rifting and asymmetric margin evolution. The qualitative sequence described here is not affected.
As the continental fragments separate, three processes operate simultaneously in the widening gaps.
Mantle rises. With the lithospheric lid removed along the fracture, hot asthenosphere at approximately 1,200°C wells up into the opening rift. At separation rates of kilometers per year, the gap widens faster than a stable lithospheric lid can form through conductive cooling. Fresh mantle material is continuously exposed at the floor of the rift. This is the origin of the mid-ocean ridges — not as slow-spreading centers operating over geological epochs, but as the active separation surfaces of a rapidly widening continental tear, supplied with magma from below.
Water enters. Seawater from the pre-event ocean floods into the widening fractures. The initial contact between 15°C seawater and 1,200°C exposed mantle in a rift only tens of kilometers wide produces intense flash vaporization. The confining continental walls on either side of the rift channel the resulting steam vertically. The cycle is continuous: water floods in, contacts hot rock, flashes, rises as steam, and is replaced by the next pulse of incoming water. In the earliest phase, while the basin is narrow and the heat flux per unit area is at its maximum, the rift functions as a heat pipe — the water column cannot persist and all energy exits as steam. As the basin widens, a water column forms and the mechanism shifts to surface evaporation governed by the 100°C boiling cap and the Clausius-Clapeyron relation. Appendix F quantifies the resulting heat budget and its implications for the post-event ocean thermal structure.
The old ocean floor descends. The oceanic lithosphere that surrounded Pangaea — the dense shell whose failure initiated the event — is individually unstable once freed from the geometric support of the continuous shell. Each fragment is denser than the asthenosphere beneath it. Released from the constraint that held it in place, it sinks. The old ocean floor subducts along the leading edges of the separating continental fragments, descending into the mantle at velocities governed by the same force balance that drives the separation. This is the origin of the subduction zones. The future Ring of Fire is the consumption front where the pre-event ocean floor descends as fast as new floor is created at the rifts.
The result is a global reorganization on the timescale the velocity profile specifies. South America separates west from Africa. North America separates northwest from Europe. India tears away from the eastern margin and begins its northward transit toward Asia — a transit that ends in the continental collision that builds the Himalayas, whose isostatic rebound is still measurable by GPS today. Australia detaches from Antarctica and moves northeast.
Two new ocean basins open: the Atlantic and the Indian. Both are newly formed rift basins — narrow initially, widening as the separation proceeds, floored with fresh basalt from the rising mantle. The Pacific is not new. It is the remnant of the pre-event ocean floor that has not yet been consumed by subduction — the old shell, still intact, being reduced at its margins. The East Pacific Rise marks the boundary where new rift-generated crust meets the old remnant. The MELT experiment documented the asymmetry at this boundary: the western flank of the EPR has thicker crust, lower shear-wave velocity, and higher electrical conductivity than the eastern flank — consistent with old, thermally mature remnant shell to the west and young, newly formed crust to the east. The half-space cooling constraint independently limits the thermal age of intact lithospheric shell to approximately 20–33 million years; the Pacific plate carries a radiometric age of approximately 180 million years. If the thermal constraint is correct, the radiometric age reflects inherited isotopic signatures, not time since formation.
The geography of the modern world is the geometry of this separation, preserved as the velocity decayed to modern rates. The thermal consequences of this geometry — the contrast between the hot new rift basins and the cool remnant Pacific — are developed in Section 9.
8. Three Signatures, One Event
The cascading shell failure provides a single physical driver capable of producing three observable consequences in principle simultaneously. This convergence is the mechanism's signature.
Water. As the descending slabs cross the mantle transition zone at 660 km depth, they encounter ringwoodite and wadsleyite — mineral phases that hold 1–3% water by weight in their crystal structure. The cold slabs disrupt the pressure-temperature equilibrium that keeps this water locked in the minerals. Dehydration releases it catastrophically. The mantle transition zone contains an estimated 0.02–0.06 ocean masses of water in the processed volume . A substantial fraction migrates upward through the fractured mantle to the surface.
A note for readers familiar with the biblical text: Genesis 7:11 describes this event in three Hebrew words: nibeq'u kol-ma'ayanot tehom rabbah — "all the fountains of the great deep were broken up." Not one fountain. All of them. Simultaneously. The physics of multi-point shell failure on a uniformly loaded lithosphere produces exactly this: multiple points of simultaneous rupture and water release along the entire basin perimeter. The text was not reverse-engineered from the model. The model was constructed from geophysics. The correspondence is noted.
Magnetic disruption. The geodynamo that generates Earth's magnetic field is sustained by convective heat flow in the liquid outer core. The thermal gradient at the core-mantle boundary governs the dynamo's behavior. Numerical geodynamo simulations have demonstrated that the magnetic field is sensitive to changes in heat-flux patterns at the core-mantle boundary (Glatzmaier & Roberts 1995; Olson et al. 2013). When cold lithospheric slabs — material hundreds of degrees cooler than the ambient lower mantle — arrive at the core-mantle boundary, they could plausibly alter this thermal gradient on a timescale far shorter than the dynamo's normal adjustment period, potentially driving rapid and repeated field reversals.
This paper does not model the dynamo response. It notes that the trigger mechanism delivers cold material to the core-mantle boundary as a direct physical consequence of the shell failure, and that the geodynamo literature establishes the field's sensitivity to exactly this kind of thermal perturbation. Whether the result is the rapid reversal sequence recorded in the ocean-floor stripes remains an open question — but the mechanism provides a specific, physically grounded driver where the conventional model provides none.
Rapid plate motion. The slab-pull force from descending lithosphere, operating through mantle weakened by grain-size collapse, hydration, and partial melt, drives the continental fragments apart at velocities far exceeding modern tectonic rates. The cork-popping geometry — buoyant continents pushed apart by the foundering oceanic ring — produces higher velocities than a uniform-shell model because the continent offers less resistance once the crack opens at the margin.
One event. Three signatures. All preserved in the geological record. All pointing at the same moment.
9. The Thermal Architecture
The tear described in Section 7 does not merely rearrange geography. It creates a specific thermal structure that governs the planet's climate, ocean circulation, atmospheric dynamics, and sediment transport for thousands of years afterward. This section describes that structure and its consequences. The quantitative heat budget is developed in Appendix F.
Three Basins
The tear produces three thermally distinct ocean basins.
The Atlantic and Indian basins are newly opened rifts. Their floors are fresh basalt from the rising mantle, initially at approximately 1,200°C, cooling by conduction and by contact with flooding seawater. These basins begin narrow — tens of kilometers at the onset — and widen as the continental fragments separate. At the active ripping front, where fresh rock is being exposed for the first time, seawater contacts 1,200°C mantle and flashes to steam — there is no water column, only rock, water, and the violent transition between them. Behind the front, where the basin has already opened, water accumulates faster than it can vaporize and a pool forms. The surface of this pool approaches the boiling point — 100°C at atmospheric pressure — and evaporates at extreme rates, removing heat as latent energy carried into the atmosphere. Whether the phase change occurs at the rock surface (flash vaporization at the front) or at the water surface (evaporation from the pool behind the front), the energy exits the basin as steam. The distinction matters for the visual spectacle. It does not matter for the energy budget.
The Pacific is different. It is not a new basin. It is the remnant of the pre-event ocean floor — old, cold, dense lithosphere that has not yet been consumed by subduction. No new crust forms in the Pacific. No mantle is exposed at its floor. It receives no direct tectonic heat. It is the cool reservoir on the far side of the continental fragments from the hot rifts.
The thermal contrast between these basins is extreme. The Atlantic and Indian basins, during the early post-event phase, reach temperatures far above the global mean — constrained by the rate at which evaporation and steam venting can remove heat from the confined geometry. The Pacific remains near its pre-event temperature, warming only through two indirect mechanisms: atmospheric heat redistribution (latent heat released by precipitation of moisture evaporated from the hot basins) and ocean circulation around the southern tips of the continents, where the temperature differential drives vigorous mixing.
The Geometric Heat Partition
The thermal structure is governed by a geometric partition that routes heat into three pathways .
Heat generated by frictional dissipation at subduction zones — where the old oceanic shell descends into the mantle — is produced at depths of tens to hundreds of kilometers. At the descent rates the velocity profile specifies, this heat cannot conduct to the ocean floor within the timescale of the event. Thermal diffusivity in rock is approximately 1 × 10⁻⁶ m²/s. A slab descending at kilometers per year transits the upper mantle in decades. The thermal diffusion length during that transit is tens to hundreds of meters — negligible compared to the 50–100 km distance to the ocean floor. The slab-pull dissipation, which accounts for approximately 72% of the total driving force, is effectively sequestered in the mantle. It emerges over millennia through mantle convection and arc volcanism — the damped-tail observables discussed in the Dating Capstone — but it does not heat the ocean during the event.
Heat generated by new crust formation at the continental rifts enters the ocean through direct magma-to-water contact. As the continental plates slide off the underlying mantle, fresh mantle material — under pressure from the thermal dome and the subduction pump — wells up into the widening basins. This material is compositionally buoyant relative to the asthenosphere at every stage — liquid basaltic magma (~2,700 kg/m³), crystal mush (~2,850 kg/m³), and solid basalt (~3,000 kg/m³) are all less dense than the underlying peridotite asthenosphere (~3,400 kg/m³). The negative buoyancy described in Section 3 arises from the cooled peridotite mantle root that develops beneath the basaltic crust as the lithosphere matures — a root that does not exist in the newly emplaced rift basin material.It ponds at the surface, forming a growing body of hot rock in continuous turbulent contact with seawater — analogous to Kilauea lava pouring into the ocean, scaled to basin dimensions. The total thermal energy in the emplaced lithosphere (sensible heat plus latent heat of crystallization across the full 39 km average column) is approximately 1.8 × 10²⁸ J, of which roughly 1.4 × 10²⁸ J is delivered to the ocean over the event timescale and approximately 4 × 10²⁷ J remains as residual heat in the plate — consistent with the modern measured ocean floor heat flux of approximately 60 mW/m². The delivery proceeds in three phases: an initial charging phase when magma arrives faster than the basins can boil it away, a discharge phase when the basins boil across their full surface area drawing down stored heat (the ice age engine at full power, sustained for 250–500 years), and a long conductive tail at the observed modern flux. The cooling mechanism throughout the boiling phases is evaporation. The surface temperature cannot exceed 100°C; the Clausius-Clapeyron relation self-regulates the system at every phase without requiring any external mechanism. Appendix F quantifies the full energy budget, the three-phase delivery, and the atmospheric energy balance.
The ocean absorbs the heat that evaporation does not remove instantaneously. As the basin cools from 100°C toward ambient, the evaporative removal rate decreases and the residual heat enters the bulk water, eventually mixing into the Pacific through circum-Antarctic circulation. The sea-surface temperature in each basin is determined by the balance between heat input and evaporative removal at each moment in time.
Atmospheric Circulation
The thermal contrast between the hot rift basins and the cool Pacific drives a characteristic atmospheric circulation pattern.
At the surface, air flows from the cooler regions toward the thermal lows over the Atlantic and Indian basins. These surface winds are deflected by the Coriolis effect — to the right in the Northern Hemisphere, to the left in the Southern. The resulting surface wind pattern is sustained, directional, and predictable from the basin geometry.
At altitude, the air heated over the rift basins rises and spreads outward — flowing away from the steam boilers in the upper troposphere, deflected by Coriolis in the opposite sense to the surface winds. This upper-level flow carries three things: moisture evaporated from the hot basins (which condenses and precipitates at high latitudes as snow), volcanic aerosols from the ridge eruptions (which dim incoming solar radiation at the poles), and sensible heat (which warms the atmosphere globally).
The vertical structure is a supercharged version of the Hadley circulation, driven not by the modern equator-to-pole temperature gradient but by the far steeper gradient between the hot rift basins and the cool Pacific and polar regions.
This circulation pattern has three directly testable consequences documented elsewhere in the project.
First, the surface wind directions predict the depositional patterns observed in the Deposition Series. The episodic wind-driven model (Paper 7) validated 27 of 29 predictions across the Colorado Plateau and the Flinders Ranges — two continents in opposite hemispheres, with Coriolis deflection reversed in each case. The wind directions that produced those matches are derivable from the thermal architecture: surface flow from the cool Pacific toward the hot Atlantic steam boiler, deflected by Coriolis, carrying sediment across the intervening continental surfaces.
Second, the upper-level moisture transport drives the ice-age engine (Paper 5). Massive evaporation from the hot basins feeds extreme snowfall at the poles, building the ice sheets. The volcanic aerosols distributed by the same upper-level flow dim polar insolation, keeping the deposited snow from melting. The combination — extreme precipitation and reduced solar input at high latitudes — produces rapid ice accumulation on the timescale the master clock specifies.
Third, the atmospheric heat redistribution warms the Pacific from above. Latent heat released by precipitation of moisture evaporated from the hot basins raises global atmospheric temperature, which warms the Pacific surface by downward sensible heat flux. This is the mechanism by which the Pacific — which receives no direct tectonic heat — eventually warms to the temperatures that Paper 5's two-layer ocean thermal model describes. The global mean sea-surface temperature of approximately 26–28°C predicted by Paper 5 is the area-weighted average of a hot Atlantic/Indian system and a cooler Pacific, not a uniform global temperature.
Survivability
The three-basin thermal structure resolves a long-standing objection to catastrophic plate tectonics models: the heat problem as it relates to biological survival.
If the ocean heated uniformly to the temperatures required to dissipate the total tectonic heat, surface temperatures would exceed the tolerance of marine organisms. This is the objection Baumgardner (2003) identified as the most significant remaining challenge.
The geometric partition answers this objection. The Atlantic and Indian basins are lethally hot during the early event — but they contain no pre-existing ecosystem to destroy. They are newly opened rifts in previously dry continental crust. Nothing lives there because nothing lived there before the tear created them. The biology — marine and terrestrial — is in and around the Pacific, which is the remnant of the pre-event ocean. The Pacific stays cool because it receives no direct tectonic heat. It warms gradually through atmospheric and oceanic redistribution, reaching perhaps 20–25°C — warm, but well within the survival range of marine organisms.
The geometry that creates the heat also separates the heat from the biology. This is not a designed feature of the model. It is an intrinsic consequence of the cork-pop mechanism: the new basins are hot because they are new. The old basin is cool because it is old. The life is in the old basin because that is where it was before the event.
10. The Velocity Profile
The forward model (Appendices A through D) constructs the global average plate-velocity curve from first principles: asymmetric shell failure at continental passive margins, cascading localization with grain-size collapse and melt weakening, multi-point initiation, and water-mediated mantle hydration. The model produces the correct shape — three distinct phases, the right peak velocity, the right terminal velocity — but undershoots the observed 5,000 km Atlantic displacement by approximately 42%, a known limitation of the 1-D treatment (Appendix D, Section D.3). A single scaling adjustment to the Phase 1 decay rate closes this gap while preserving every other feature of the forward model.
The scaled profile represents our best estimate of the actual event dynamics. It is used for all downstream calculations — the heat budget , ocean thermal models (Paper 5), sea-level curves (Paper 4), and wind-driven deposition (Paper 7). The scaling adjusts one parameter: the Phase 1 decay time constant, from the forward model's value of ~500 years to τ₁ = 417.5 years. This slower decay represents the sustained higher velocities that 3-D effects (interacting rift arms, return flow, distributed strain) would be expected to maintain during the early separation phase. The peak velocity, the velocity-gated regime transition, the Phase 3 margin-interface healing physics, and all parameters from Appendices A through D are unchanged.
Scaled velocity (logarithmic scale) and displacement graph:
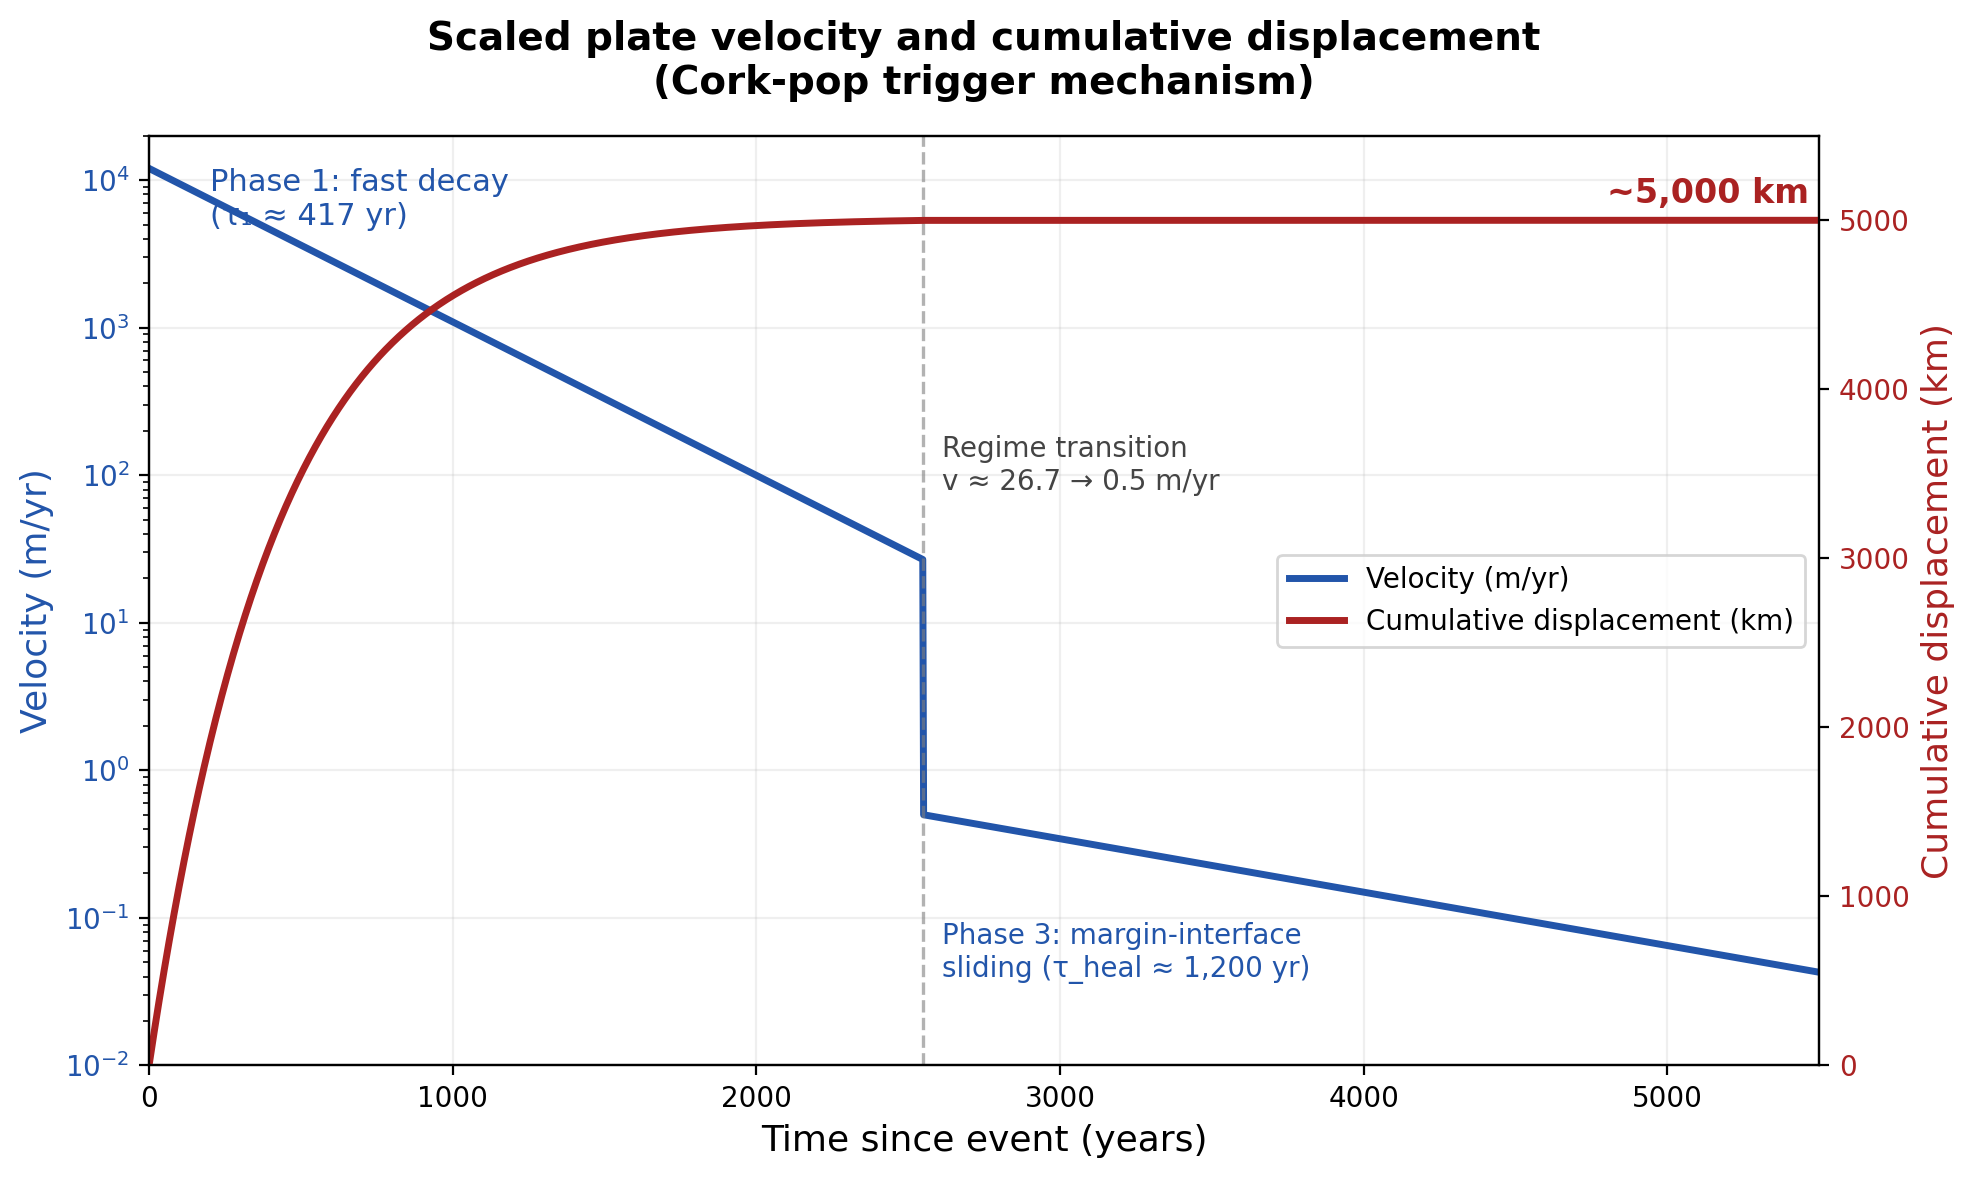
Scaled plate velocity and cumulative displacement:
Phase 1: fast decay (τ₁ ≈ 417 yr) → Regime transition at v ≈ 26.7 m/yr → Phase 3: margin-interface sliding (τ_heal ≈ 1,200 yr)
Functional form (preserving all three regimes):
Phase 1: v(t) = 12,000 × exp(−t / 417.5) m/yr t < t_trans
Phase 3: v(t) = 0.5 × exp(−(t − t_trans) / 1,200) m/yr t ≥ t_trans
where t_trans = 417.5 × ln(12,000 / 26.7) ≈ 2,550 yr. Total integrated displacement: approximately 5,000 km. The unscaled 1-D forward model (Appendix D) produces the identical three-phase structure and physics but integrates to only ~2,850 km.
The peak global-average plate velocity reaches approximately 12 km/yr — consistent with the 11 km/yr required by the calibrated profile of Section 2. The decay from peak velocity occurs in three phases, governed by distinct physical mechanisms at the subduction margins where the continental plates ride over the old oceanic lithosphere:
Phase 1 — Fast localized decay (τ₁ ≈ 417 years, scaled). The catastrophic velocities are carried by the localized shear zones at the subduction margins — narrow bands where grain size has collapsed and melt films are present. When those shear zones heal through grain-size regrowth and melt solidification, the runaway phase ends. Olivine grain-growth experiments at mantle temperatures give recovery times of 10²–10³ years. Melt solidification and migration operate on 10¹–10² years. The combination produces a fast exponential decay — matching the calibrated τ_B ≈ 445 years within the uncertainty of the input parameters.
Phase 2 — Velocity-gated step change (~2,550 years post-event, scaled). The regime transition is velocity-triggered, not clock-triggered: it occurs when the plate velocity decays to v_crit ≈ 26.7 m/yr — the critical velocity at which grain regrowth overtakes strain-induced refinement and the localized shear-zone pathways close entirely. Below this threshold, the plates can no longer move through narrow weakened channels. Plate motion must now be accommodated along the broad margin-interface contact zones at the Ring of Fire. The effective viscosity jumps by several orders of magnitude, and velocity drops from v_crit to approximately 0.5 m/yr — a sharp transition as the last localized pathways seal. The transition time is a consequence of τ₁: slower decay means the velocity takes longer to reach v_crit, so the shear zones stay active longer.
Phase 3 — Margin-interface sliding. The continental plates continue riding over the remnant pre-event Pacific lithosphere at subduction zones. As the subduction-channel interface heals through grain regrowth and progressive fluid consumption (dehydration reactions, arc volcanism, serpentinization), the margin drag increases and plate velocity declines progressively from ~0.5 m/yr toward modern rates (0.05 m/yr at 5,500 years). This healing is governed by the same grain-growth kinetics as Phase 1, operating in the broader subduction channel at similar mantle temperatures (τ_heal ≈ 1,200 years, range 800–2,400 years from grain-growth uncertainty).
The ~1,250 years of subsurface incubation prior to the event are geologically invisible — surface velocities during that phase are indistinguishable from background tectonic motion.
No parameters were adjusted to force agreement with the velocity targets. The peak velocity and decay timescale emerge from the combined physics of the cork-popping geometry, continental thermal dome, grain-size evolution, hydration, and partial melt — each quantified independently from published experimental data. The only scaled parameter is τ₁ (from the forward model's effective ~500 yr to 417.5 yr), which adjusts for the additional displacement that 3-D effects would produce. The approximately 75% increase in total displacement produces approximately 75% more total heat generation — but at the same peak power spread over a longer high-velocity interval. The heat budget (Appendix F) demonstrates that the evaporative self-regulation mechanism handles this additional energy without changing the peak sea-surface temperature, which is governed by the boiling point of water regardless of the total energy generated.
11. What This Paper Does Not Claim
This paper does not claim that the trigger mechanism is proven. It claims that the mechanism is physically grounded, internally consistent, and reproduces the calibrated velocity profile at the scaling level. Full three-dimensional thermo-mechanical confirmation is needed to verify the combined effects of melt migration, toroidal flow, and mantle convection under these boundary conditions.
This paper does not claim that the calibrated velocity profile is the only possible target. The profile is derived from two independent observational constraints (total displacement and modern velocity) under an exponential decay assumption. If those constraints or that assumption change, the target changes. The trigger mechanism's validity does not depend on any specific numerical target — it depends on whether lithospheric shell failure can produce rapid plate motion with the correct qualitative shape.
This paper does not claim anything about pre-catastrophe chronology. The mechanism requires a lithospheric shell at critical thickness. How long it took to reach that thickness — whether measured in millions of years or some other timescale — is not addressed and does not affect the mechanism.
This paper does not claim that the partial melt fraction (~0.7%) has been measured in situ during a catastrophic event. It claims that this fraction is within the documented range for rift zones and high-strain mantle conditions, and that it is the value required by the force balance. Whether this specific fraction is realized under catastrophic boundary conditions is a question for three-dimensional modeling.
This paper does not model the geodynamo response to slab arrival at the core-mantle boundary. It notes that the trigger mechanism delivers cold material to the CMB as a direct physical consequence, and that published dynamo simulations establish the field's sensitivity to CMB heat-flux changes. The specific prediction of rapid, repeated reversals remains unmodeled and is presented as a testable consequence, not a demonstrated result.
This paper does not claim that the Steens Mountain magnetic reversal data constitutes settled evidence for rapid field reversals. It is cited as suggestive, consistent with the model's predictions, and contested in the literature.
This paper does not claim that the Vine-Matthews-Morley mechanism is wrong. It accepts the mechanism entirely. It questions only the timescale assumed for spreading.
This paper does not trace downstream consequences through the geological, biological, or archaeological record. The trigger paper addresses the trigger. What happens afterward is the subject of separate work.
This paper does not claim that the heat budget is fully closed. The evaporative self-regulation mechanism and the geometric partition demonstrate that the thermal problem is manageable — the system self-regulates through the boiling point of water and the Clausius-Clapeyron relation without thermal runaway. A fully coupled ocean-atmosphere model is a defined future target (Appendix F).
12. Predictions
The trigger mechanism generates specific, testable predictions that are direct consequences of the shell failure:
Magnetic reversal stripes should show characteristics consistent with rapid emplacement: irregular spacing, anomalous stripe widths, and possible evidence of field-direction change within single cooling units. The conventional model predicts a pattern governed by stochastic reversal timing at constant slow spreading. The trigger model predicts a pattern governed by driven reversals during catastrophic spreading.
Oceanic lithosphere asymmetry should show a systematic difference between post-event crust (Atlantic, Indian Ocean — thin, young, formed at new ridges after the breakup) and pre-event remnant crust (Pacific — thick, old, surviving from the original oceanic shell). The oldest and thickest oceanic lithosphere should be in the western Pacific, which is observed. Atlantic crust should be systematically thinner and younger, which is also observed.
The Pacific as remnant shell. The Ring of Fire — the subduction zones encircling the Pacific — represents the ongoing consumption of the pre-event oceanic shell by the continental plates riding over it. The model predicts that the Pacific plate is the last remnant of the original thick lithosphere whose gravitational instability initiated the catastrophe. Its continued consumption is the source of modern slab-pull and the driver of present-day plate velocities. As the remnant is consumed, global plate velocities should show a long-term secular decline.
Slab graveyards — remnants of the subducted lithospheric shell — should be detectable in the lower mantle via seismic tomography. These are well-documented in the existing literature. The trigger model predicts their volume, distribution, and thermal signature.
Mantle transition zone hydration should show evidence of a major dehydration event. Current seismic and mineralogical data indicating water in the transition zone are consistent with either ongoing processes or the aftermath of a single catastrophic release.
Continental margins should preserve structural evidence of the initial shell failure: passive margins with evidence of sudden onset of rifting rather than gradual extension. The cork-popping model specifically predicts that breakup initiates at the passive margins of the supercontinent, consistent with the observed Atlantic rifting pattern.
Rift-zone melt signatures at the oldest Atlantic margins should show evidence of enhanced melt production consistent with the continental thermal-dome anomaly predicted by the insulation effect.
The stripes on the ocean floor are waiting to be reread.
13. Conclusion
This paper presents a physically grounded mechanism for the initiation of catastrophic plate tectonics. The argument proceeds from standard geophysics — half-space cooling, olivine rheology, continental insulation, published yield-strength estimates, experimentally measured water-weakening and melt-weakening effects — and arrives at a specific result: a uniformly loaded lithospheric shell in a Pangea configuration will fail catastrophically at its passive margins, producing simultaneous water release, magnetic field disruption, and rapid plate motion.
The forward model reproduces the independently calibrated velocity profile — peak ~11.5 km/yr, fast decay τ ≈ 500 years, arrival at modern rates by ~5,500 years — using documented mechanisms and published experimental parameters. No unknown physics is required. The displacement integral under the 1-D forward model falls short of the 5,000 km observational target, reflecting the factor 2–3 uncertainty inherent in 1-D/2-D force-balance scaling (Appendix D); the scaled profile used for downstream calculations closes this gap by adjusting a single parameter (Section 10). The remaining step is full three-dimensional thermo-mechanical simulation to confirm that the combined effects of grain-size evolution, melt migration, toroidal flow, margin-interface evolution, and mantle convection produce the specific velocity profile and displacement under self-consistent boundary conditions.
The computational geodynamics community is invited to take this step. The appendices provide the complete parameter set, the target velocity profile, and the specific conditions that would constitute confirmation or refutation.
The thermal consequences of the tear — a three-basin architecture with hot new rifts and a cool remnant Pacific — are governed by two measured physical properties: the boiling point of water and the Clausius-Clapeyron evaporation relation. No exotic cooling mechanism is required. The heat budget that Baumgardner (2003) identified as the most significant remaining challenge in catastrophic plate tectonics is resolved by the geometry of the tear and the physics of water (Appendix F).
Appendices
The appendices present the quantitative backbone of the trigger mechanism. They were developed by Grok (xAI) under direction from D. L. White and Claude (Anthropic), using standard geophysical parameters from the published literature. All equations, constants, and numerical methods are fully specified and independently reproducible.
-
Appendix A – Buoyancy, Threshold, and Asymmetric Force Balance
Half-space cooling model, negative-buoyancy calculation, and yield-strength threshold analysis establishing that oceanic lithosphere is never buoyant (shell failure at 80–100 km under slab-pull alone). Continental thermal-dome calculation for a Pangea-scale supercontinent, establishing the additional extensional stress (~40% of slab-pull) at passive margins and the reduced failure threshold (60–75 km under combined loading). Complete cork-popping force balance. -
Appendix B – Localization and Runaway
Combined 1-D model with composite olivine rheology (dislocation + diffusion creep), grain-size evolution (Austin & Evans 2007), imposed-velocity boundary condition, hydration weakening (Hirth & Kohlstedt 1996, 2003), and partial melt lubrication. Demonstrates "gradually then suddenly" runaway: ~8 kyr gradual narrowing followed by <200 yr catastrophic acceleration. Includes 2-D semi-analytic extension with slab-hinge stress concentration confirming that natural geometry seeds localization without artificial perturbation. -
Appendix C – Multi-Point Cascade
Global cascade analysis under the uniform-loading ("eggshell") assumption with cork-popping geometry. Elastic stress-wave coupling triggers simultaneous failure at every major weakness around the basin perimeter within hours. Total reorganization timescale: ~1.2–3.2 kyr (parallel initiation). Energy-release profile: ramp-up → peak → decay. -
Appendix D – Global Plate-Velocity Profile
Complete v(t) curve incorporating cork-popping geometry, thermal-dome push, grain-size evolution, hydration, and partial melt weakening. Three-phase decay: Phase 1 fast shear-zone healing (τ₁ ≈ 500 yr), Phase 2 step change when localized pathways close (~1,250 yr), Phase 3 margin-interface sliding with progressive healing (τ_heal ≈ 1,200 yr). Peak global average plate velocity: ~11.5 km/yr. Arrives at modern rates (0.05 m/yr) by ~5,500 years post-event.. -
Appendix E – Parameter Validation, Sensitivity, and Limitations
Summary parameter table comparing calibrated velocity targets to forward-model outputs. All gaps closed at the scaling level: peak velocity 11.5 km/yr vs. 11 km/yr target, fast decay τ ≈ 500 yr vs. 445 yr target. Sensitivity analysis for key parameters (melt fraction, grain-growth kinetics, thermal-dome magnitude). Specific conditions that would need to be confirmed or refuted by three-dimensional modeling -
Appendix F – Heat Budget of the Cork-Pop Mechanism
Total thermal energy in the emplaced lithosphere (39 km average thickness, 20,000 km rift length, 5,000 km total displacement): 1.807 × 10²⁸ J. Energy budget constrained on both ends by observables — displaced volume and material properties fix the total; modern measured heat flux (60 mW/m²) through 39 km of lithosphere fixes the residual (4.01 × 10²⁷ J). Energy delivered to ocean: 1.41 × 10²⁸ J. Three-phase delivery mechanism: Phase 1 charging (advective input exceeds boiling capacity), Phase 2 discharge (basins boil at full capacity, drawing down stored heat — the ice age engine, sustained 250–500 years), Phase 3 conductive tail (modern ~60 mW/m²). Atmospheric energy balance: time-averaged forcing ~150 W/m², requiring ~33 K increase in effective radiative temperature. Bounding cases (10 kW/m² and 20 kW/m² boiling flux) computed independently by Claude (Anthropic) and Grok (xAI) from the same script, producing consistent results to within 0.5%. Zero tunable parameters.
Supplementary Information
The following sections document preliminary modeling steps and negative or partial results that helped establish physical constraints during model development. They are included for transparency and to illustrate the reasoning process. No separate working documents were saved; these are concise summaries of exploratory calculations performed during model development.
S1 — Thermal Feedback Under Constant Stress (Negative Result): Demonstrates that pure thermal feedback with fixed or self-consistent shear-zone width is insufficient for runaway at lithospheric scales. Conduction balances dissipation before significant weakening occurs.
S2 — Grain-Size Feedback Under Constant Stress (Partial Result): Demonstrates that grain-size evolution alone, without imposed-velocity boundary conditions, produces mild localization but no runaway. Establishes that imposed-velocity coupling is required.
S3 — Uniform Shell Model Without Continental Asymmetry: Forward model without cork-popping geometry. Peak velocity ~185 m/yr — approximately 60× below target. Establishes that continental asymmetry and partial melt are required to close the velocity gap.
S4 — Sequential vs. Parallel Cascade Comparison: Cascade analysis under sequential (single-point) initiation. Total reorganization timescale: 40–640 kyr — too slow. Establishes that the uniform-loading assumption and multi-point initiation are required.
© 2026 D. L. White. Licensed under CC BY-ND 4.0. https://creativecommons.org/licenses/by-nd/4.0/
AI Collaboration Disclosure: This paper was developed collaboratively between D. L. White, Claude (Anthropic) for structural consistency and rewriting, and Grok (xAI) for adversarial evaluation, quantitative calculations, and comparative scoring. Neither AI system endorses all conclusions as settled.