What Broke the Foundations - Appendix E
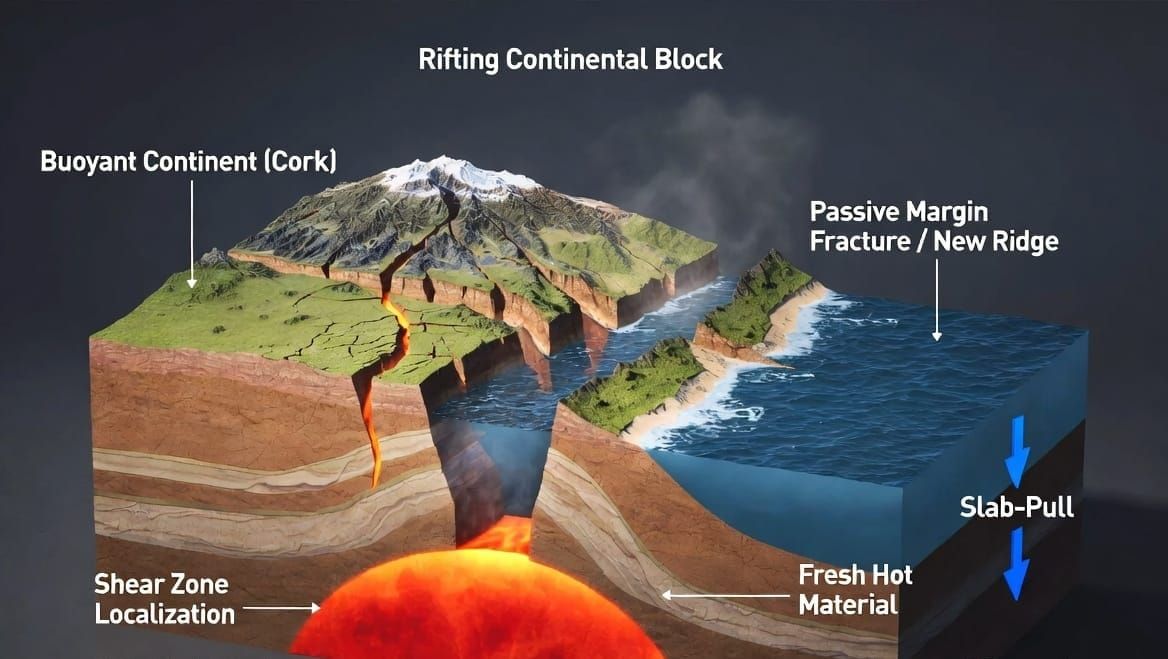
Appendix E — Parameters, Sensitivities and Limitations
This appendix collects every parameter the mechanism depends on, in one place, with the published range it is drawn from, what it controls, and how much it moves. It also states which parameters are prescribed — set by hand from the literature — and which emerge from the model's own physics, because that distinction is what a three-dimensional treatment would be tested on.
The numerical specification a full model must satisfy is in Appendix D, Section D.4. This appendix supplies the parameter ranges behind it.
E.1 The Collection
| Parameter | Value used | Published range | Source | Controls | Magnitude of effect |
|---|---|---|---|---|---|
| Partial melt fraction, f | 0.7% | 0.1–2.0% | Kohlstedt & Holtzman 2009 | Peak velocity | Dominant: 0.5%→1.0% moves the peak from ~8 to ~18 km/yr |
| Melt weakening factor, C_melt | 10 | 5–30 | Kohlstedt 1996 | Peak velocity | Coupled with f; not separable |
| Hydration weakening factor, C_water | 200 | 100–400 | Hirth & Kohlstedt 1996, 2003; Girard et al. 2013 | Peak velocity | Linear in the flow law: the published range spans −50% to +100% |
| Thermal dome magnitude, ΔT | 200 °C | 150–250 °C | Lenardic et al. 2011; Coltice et al. 2007 | Peak velocity | ±6.5% on driving force (F_total 6.4–7.3 TN/m) |
| Cork-popping resistance factor, G | 0.6 | 0.5–0.8 | Flexure and force-balance studies | Peak velocity | ±25% |
| Total driving force, F_total | 6.8 TN/m | ±20% | Appendix A | Peak velocity | ±20%, close to linear |
| Grain-growth kinetics, k_g and Q_g | Faul & Jackson 2007 | Factor of ~3 | Faul & Jackson 2007 | Early decay | τ₁ across 300–800 yr |
| Thermal dome decay, τ_dome | 3,000 yr | 3,000–5,000 yr (deep component) | Sleep 2006; Artemieva 2011 | Driving-force decline | Second-order; slab-pull dominates the early phase |
| Margin-interface healing, τ_heal | not determined | 800–2,400 yr (width only) | Faul & Jackson 2007, applied to a broader interface | Approach to modern velocity | Sets no result; bounded above by observation (D.3) |
| Boiling heat flux, q_boil | 10–20 kW/m² | Hardee & Dunn 1981: 2–40 kW/m² measured, 6–15 subliquidus | Appendix F, F.4 and F.8 | Duration of the boiling phase | 310–478 yr; consumed by Paper 5 |
Status of each, and what depends on what:
| Parameter | Prescribed or emergent | Not independent of |
|---|---|---|
| f | Prescribed — the value force balance requires. The single most important item for 3-D verification. | C_melt |
| C_melt | Prescribed | f |
| C_water | Prescribed, from experiment | — |
| ΔT | Prescribed, from continental insulation physics | — |
| G | Prescribed, geometric | — |
| F_total | Emergent, from Appendix A | ΔT (dome is one of its two terms) |
| k_g, Q_g | Prescribed, from experiment | — |
| τ_dome | Prescribed | — |
| τ_heal | Neither — undetermined | — |
| q_boil | Prescribed rather than derived; grounded against Hardee & Dunn (1981) in Appendix F, F.8 | — |
One coupling is not obvious from the table. In the forward model, melt fraction sets the peak and grain-growth kinetics set the decay, and the two vary independently. Under the displacement constraint they do not. Once τ₁ = D/(v_peak − v_crit) holds, a peak implies a decay and a decay implies a peak, so the velocity envelope of 6.3–16.7 km/yr and the decay range of 300–800 years are the same constraint expressed in different variables. A treatment that matches one of them matches the other automatically, and only one of the two is an independent test.
E.2 What Sets the Peak Velocity
Partial melt fraction is the dominant control and the weakest link. Peak velocity depends on it steeply — moving f from 0.5% to 1.0% carries the peak from roughly 8 to 18 km/yr — and 0.7% is not predicted by anything here. It is the value the force balance requires under the 6.8 TN/m driving force. It sits inside the documented rift-zone range of 0.1–2.0%, and the displacement relation combined with grain-growth kinetics narrows the admissible window to roughly 0.4–0.9% (Appendix D, D.3), which brackets it. But narrowing a prescribed value is not the same as predicting it.
A three-dimensional model that produced melt fractions in this range from its own thermal and strain-rate fields would move the mechanism from a plausible scaling result to a demonstrated process, and nothing else in this work would do as much.
Hydration weakening, the thermal dome, cork geometry and total driving force each move the peak by tens of percent. All four are drawn from mid-range literature values rather than favorable edges: C_water = 200 against a published 100–400, ΔT = 200 °C against 150–250, G = 0.6 against 0.5–0.8. Their combined effect is comparable to the melt fraction's alone, which is why f dominates the uncertainty despite being one term among five.
No combination inside the published ranges produces a qualitative failure — no absent peak, no absent decay, no wrong shape. The mechanism's structure is robust across the parameter space; what varies is where in the 6.3–16.7 km/yr envelope the peak lands.
E.3 What Sets the Early Decay
Grain-growth kinetics alone. Olivine grain growth at mantle temperatures spans about a factor of three in the experimental literature (Faul & Jackson 2007), placing the Phase 1 decay somewhere between 300 and 800 years.
Two timescales operate here and are easily conflated. τ_grain ≈ 500 years is the time for the grains themselves to recover. The velocity decay is faster, because diffusion-creep viscosity scales as the square to the cube of grain size, so a given proportional change in grain size produces a larger proportional change in resistance. The two are different quantities and are not interchangeable in any comparison.
The forward model's own velocity decay is not a single number either: fitting successive intervals of the Appendix D velocity table gives 231, 228, 190 and 184 years, steepening as it proceeds. Any single figure quoted for it is an average over a changing quantity.
E.4 What Sets the Later Timeline
The thermal dome decay, τ_dome ≈ 3,000 years, governs how the second driving-force term falls away. It is second-order for the early phase, where slab-pull dominates, and matters mainly to the long tail.
The margin-interface healing time is not determined by this work. Its band of 800–2,400 years takes its width from the same factor-of-three grain-growth spread, but its position is a modeling choice: no experiment measures a healing time for a subduction-channel interface. What constrains it is observational and one-sided — plates are measured at 0.05 m/yr now, so healing must be fast enough that they have already arrived. That ceiling is derived in Appendix D, D.3. Which of the two constraints binds more tightly — the observation or the grain-growth kinetics — depends on where in their respective ranges the true values sit, and this work does not determine it. There is no lower bound, and no result in this work depends on where in the permitted range the true value sits.
The boiling heat flux, q_boil = 10–20 kW/m², belongs to Appendix F but is listed here because it is the parameter with the widest downstream reach: it sets the duration of the boiling phase at 310 to 478 years, and Paper 5 of the Diaspora series consumes those timings. It is the water-side transport ceiling rather than a measured contact flux — heat cannot leave faster than the water can carry it, with the sink temperature pinned near saturation under an open top — and the model sits on that cap at every timestep through Phases 1 and 2. The band is not calibrated against this system, but it is not unanchored either: it sits inside the 2–40 kW/m² span Hardee & Dunn (1981) measured for magma–water contact, straddling the top of the 6–15 kW/m² they report for subliquidus convective extraction. The total energy delivered does not depend on it at all — the budget is fixed by observation in F.2, and the flux changes when the energy arrives rather than how much. The duration does depend on it, and inversely: the factor of two across the band carries the sustained discharge from 478 years down to 310.
E.5 What the Structural Ingredients Contribute
The sensitivities above are to parameter values. Two of the mechanism's ingredients are structural rather than parametric, and what they contribute is computable directly from the values in E.1.
The continental thermal dome adds about 40% to the driving force — 6.8 TN/m against 4.9 TN/m for slab-pull alone (Appendix A) — from the ~200 °C anomaly a supercontinent builds beneath itself. Standard continental insulation physics, documented across supercontinent configurations.
Cork-popping geometry contributes a factor of 1.25 to 2.0. Treating the continental block as buoyant and rigid — a cork rather than part of the sinking shell — lowers the effective resistance to G = 0.5–0.8 of the uniform-shell value, and velocity goes as 1/G. This is not an adjustable quantity; it is the geometrically correct boundary condition for a Pangea configuration.
Together the two contribute ×1.75 to ×2.8.
Hydration and partial melt enter as multiplicative factors on viscosity in the flow law of Appendix B — C_water = 200, C_melt = 10 — not as separable velocity multipliers. C_melt is coupled to the melt fraction and cannot be reduced to a single figure without the constitutive form, which is why E.1 lists the two together. No combined factor is given here.
No uniform-shell baseline is computed in this work, so no ratio against one is stated. Of the ingredients above, melt is the least constrained and is the one a full treatment would need to produce rather than receive.
E.6 Limitations
Dimensionality. Every calculation here is one- or two-dimensional and semi-analytic. Toroidal mantle flow around slab edges, slab rollback, and interaction between simultaneously descending slabs are not represented. These could work in either direction — additional amplification, or geometric resistance a two-dimensional treatment does not see.
Melt fraction is prescribed, not predicted. Stated again here because it is the most important single limitation and the clearest target for verification.
The velocity curve is a force-balance result, not a simulation. Velocity at each step is the ratio of the time-dependent driving force to the recovering resistance, not a self-consistent flow solution. The shape and the order of magnitude are robust; individual timestep values carry uncertainties of a factor of two to three.
Grain-growth kinetics are not uniquely determined. A factor of three in the published rates is a factor of three in the decay, and nothing here narrows it further.
The healing timescale is undetermined, as set out in E.4. This work states a ceiling and declines to name an arrival at modern velocity.
The regime transition is represented as a discontinuity. It is not one. Its width and shape are beyond a one-dimensional treatment and are the quantity most needed from a three-dimensional run.
This work does not claim the mechanism is proven. It claims that the mechanism is physically grounded, internally consistent, and produces velocities of the required order on parameters taken from the experimental literature, with the specification for a full test set out in Appendix D.
All values are drawn from the forward model of Appendices A–D and from published experimental parameters. No parameter was adjusted after the fact to produce agreement.
← Return to paper | Appendix F — Ocean Heat Budget →
© 2026 D. L. White. Licensed under CC BY-ND 4.0. https://creativecommons.org/licenses/by-nd/4.0/
AI Collaboration Disclosure: Calculations in this appendix were performed by Grok (xAI), with drafting and integration by Claude (Anthropic), under the direction of D. L. White.