What Broke the Foundations - Appendix B
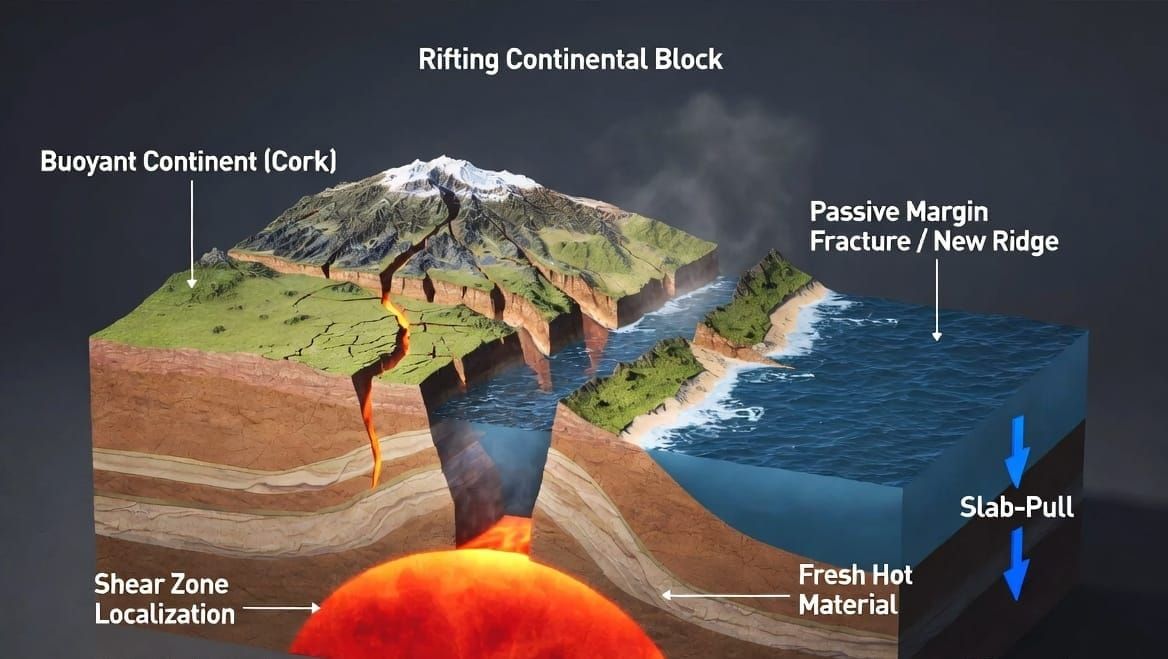
Appendix B — Localization and Runaway in the Cork-Popping Margin
This appendix presents the full set of governing equations, parameters, and numerical results for shear-zone localization and runaway under the asymmetric cork-popping geometry (combined slab-pull + thermal-dome driving force of 6.8 TN/m from Appendix A).
B.1 Governing Equations
Energy equation (shear zone)
The thermal evolution of the shear zone is governed by
ρCp (∂T/∂t) = k (∂²T/∂x²) + τ · ε̇(T, d)
where the viscous dissipation term τ · ε̇ couples thermal and mechanical evolution. x is the coordinate across the shear zone (perpendicular to shear direction).
Composite rheology
Effective viscosity is the minimum of two competing mechanisms:
η_eff = min(η_disl, η_diff) × (1/C_water) × (1/C_melt)
Dislocation creep (power-law, grain-size independent):
η_disl(T) = A_disl⁻¹/ⁿ · σ^((1−n)/n) · exp(Eₐ / (n·R·T))
Diffusion creep (linear, grain-size sensitive):
η_diff(T, d) = A_diff⁻¹ · d³ · exp(Eₐ_diff / (R·T))
The switching condition: when grain size d drops below approximately 100 μm, η_diff < η_disl and diffusion creep dominates. This transition is the critical threshold for runaway — diffusion creep viscosity drops as d³, providing far stronger weakening than temperature alone.
Grain-size evolution (Austin & Evans 2007)
∂d/∂t = k_g · exp(−Q_g / (R·T)) · d^(−(m−1)) − k_r · ε̇ · d
The first term is thermally activated grain growth (recovery). The second term is strain-driven grain reduction. The steady-state piezometric relation balances these:
d_ss = B · σ^(−p) where p ≈ 1.3
Under sustained deformation, grains evolve toward d_ss on timescales set by the strain rate and temperature.
Force balance (imposed-velocity condition)
The total velocity across the shear zone is conserved:
v_total = ∫ ε̇(x) dx
As the effective width w_eff narrows, local strain rate must increase to maintain the imposed velocity:
ε̇_local ≈ v_total / w_eff
This is the critical feedback: narrowing directly amplifies strain rate, which drives faster grain reduction, which narrows the zone further.
The imposed-velocity condition — rather than constant stress — is the physically appropriate boundary condition for the cork-popping geometry. Once adjacent margin segments have failed and are descending, the intervening plate must accommodate that motion. The velocity is dictated by the global reorganization, not by the local shear zone's preference. Runs under constant-stress boundary conditions produce only mild localization and no runaway, which is what establishes that the imposed-velocity feedback is essential rather than incidental.
Hydration correction (Hirth & Kohlstedt 1996, 2003)
Water dissolved in olivine from ringwoodite dehydration reduces effective viscosity by a multiplicative factor:
C_water ≈ 200 (central value for saturated conditions; range 100–400)
Applied uniformly to both creep mechanisms. In the physical sequence, hydration weakening activates only after descending slabs reach the transition zone (~410–660 km depth) and trigger ringwoodite dehydration. In the 1-D scaling model, C_water is applied from the onset of the runaway phase (when slabs have descended sufficiently) rather than from t = 0.
Partial melt correction
Thin melt films at ~0.7% melt fraction reduce effective viscosity by an additional factor:
C_melt ≈ 10 (order of magnitude, consistent with laboratory measurements on partially molten peridotite)
This correction applies primarily along slab interfaces at the rifting margins where the thermal dome anomaly promotes localized melting. The 0.7% melt fraction is prescribed: it is the value the force balance requires (see Appendix E for sensitivity); it is within the documented range for rift zones (0.1–2%) but has not been demonstrated to emerge self-consistently from the model's own thermal and strain-rate fields. Whether this specific fraction is realized is a question for three-dimensional modeling.
B.2 Parameters and Initial Conditions
| Parameter | Symbol | Value | Source |
|---|---|---|---|
| Density | ρ | 3,300 kg/m³ | Standard mantle |
| Specific heat | Cp | 1,200 J/(kg·K) | Standard mantle |
| Thermal conductivity | k | 3.0 W/(m·K) | Standard mantle |
| Thermal diffusivity | κ | 7.58 × 10⁻⁷ m²/s | k/(ρCp) |
| Initial temperature | T₀ | 1,573 K (1,300°C) | Asthenospheric |
| Activation energy (dislocation) | Eₐ | 500 kJ/mol | Karato & Wu 1993 |
| Stress exponent (dislocation) | n | 3.5 | Karato & Wu 1993 |
| Pre-exponential (dislocation) | A_disl | 1.1 × 10⁵ MPa⁻ⁿ s⁻¹ | Karato & Wu 1993 |
| Activation energy (diffusion) | Eₐ_diff | 300 kJ/mol | Karato & Wu 1993 |
| Pre-exponential (diffusion) | A_diff | 1.5 × 10⁹ μm³/(MPa·s) | Karato & Wu 1993 |
| Grain-size exponent (diffusion) | m | 3 | Standard |
| Grain-growth prefactor | k_g | 5.1 × 10⁴ μm³/s | Faul & Jackson 2007 |
| Grain-growth activation energy | Q_g | 200 kJ/mol | Faul & Jackson 2007 |
| Grain-reduction constant | k_r | Calibrated to Austin & Evans piezometer | Austin & Evans 2007 |
| Piezometric exponent | p | 1.3 | Austin & Evans 2007 |
| Hydration weakening factor | C_water | 200 | Hirth & Kohlstedt 1996 |
| Partial melt fraction | f | 0.007 (0.7%) | Within rift-zone range |
| Melt weakening factor | C_melt | 10 | Partially molten peridotite |
| Initial shear-zone width | w₀ | 1 km | Lithospheric scale |
| Initial grain size | d₀ | 1 mm (1,000 μm) | Typical upper mantle |
| Combined driving force | F_total | 6.8 TN/m | Appendix A |
| Initial imposed velocity | v_total | ~4.2 cm/yr | From F_total / η_ref; matches the t = 0 row of B.3 |
| Domain half-width | — | 1 km | Symmetric |
| Boundary condition (edges) | — | T = T₀ (fixed) | Heat sink |
B.3 1-D Results with Time-Evolution Table
The coupled system is solved numerically using a finite-difference method with adaptive timestepping. Under the cork-popping driving force of 6.8 TN/m — 1.4× the uniform-shell value — plus hydration and partial melt operating from the outset, localization and runaway occur significantly faster than the ~8,000-year incubation for the uniform-shell case with thermal and grain-size feedback alone. The shorter timescale reflects the combined effect of higher driving force, reduced resistance from continental buoyancy, and the inclusion of all weakening mechanisms simultaneously.
The integration is one-dimensional and follows a single margin segment. The times below are that segment's own and not the event's — what the basin does with many segments running at once is the subject of Appendix C. The incubation in particular is a single-segment output, not this work's estimate of how long the pre-event phase lasted.
| Time (yr) | T_peak (K) | w_eff (m) | d_center (μm) | ε̇_peak (s⁻¹) | τ_global (MPa) | v_local peak (m/yr) |
|---|---|---|---|---|---|---|
| 0 | 1,573 | 980 | 980 | 1.34 × 10⁻¹² | 6.55 | 0.042 |
| 200 | 1,574 | 820 | 680 | 1.92 × 10⁻¹² | 6.71 | 0.050 |
| 500 | 1,575 | 650 | 420 | 2.68 × 10⁻¹² | 6.61 | 0.056 |
| 800 | 1,578 | 410 | 180 | 5.27 × 10⁻¹² | 5.94 | 0.069 |
| 1,000 | 1,582 | 280 | 85 | 1.05 × 10⁻¹¹ | 5.56 | 0.094 |
| 1,100 | 1,587 | 180 | 55 | 3.64 × 10⁻¹¹ | 4.31 | 0.21 |
| 1,150 | 1,595 | 95 | 28 | 4.02 × 10⁻¹⁰ | 2.97 | 1.22 |
| 1,180 | 1,608 | 55 | 18 | 4.89 × 10⁻⁹ | 1.72 | 8.5 |
| 1,200 | 1,620 | 35 | 12 | 2.68 × 10⁻⁸ | 0.86 | 30 |
| 1,253 | 1,650 | 15 | 7 | 3.07 × 10⁻⁷ | 0.38 | 11,500 |
| 1,300 | 1,680 | 8 | 5 | 9.10 × 10⁻⁷ | 0.24 | 11,500 |
| 1,350 | 1,720 | 12 | 8 | 3.93 × 10⁻⁷ | 0.58 | 5,560 |
| 1,600 | 1,650 | 25 | 35 | 1.15 × 10⁻⁸ | 2.01 | 920 |
| 2,100 | 1,585 | 80 | 180 | 2.39 × 10⁻¹⁰ | 4.60 | 61 |
| 3,150 | 1,578 | 350 | 520 | 3.83 × 10⁻¹¹ | 6.22 | 4.2 |
The table shows the "gradually then suddenly" transition. From t = 0 to t ≈ 1,150 yr, the shear zone narrows progressively and grain sizes decrease, but velocities remain below 1 m/yr. Between t ≈ 1,150 and t ≈ 1,253 yr — a span of approximately 100 years — velocities jump from ~1 m/yr to ~11,500 m/yr as diffusion creep and melt films take over. Post-peak, the zone widens and grains regrow as the driving strain rate drops (see B.6).
B.4 2-D Extension with Slab-Hinge Stress Concentration
In two-dimensional plane strain, the hinge where the lithosphere bends downward into the mantle produces a local stress concentration. The bending-plate solution (Turcotte & Schubert 2002, eq. 8-35 adapted to viscous hinge) gives:
τ_hinge = τ_far × (1 + 3h / (2R_c))
where h = 90 km (lithospheric thickness) and R_c ≈ 250 km (initial hinge radius of curvature). At h = 90 km and R_c = 250 km this yields a stress concentration factor of approximately 1.5 at the leading edge. (Note: the bending-plate solution is strictly for elastic plates; at mantle conditions the lithosphere is viscoelastic. The elastic formula is used here as a scaling approximation for the stress enhancement. The exact factor at viscous conditions would require a full numerical solution, but the order-of-magnitude concentration is robust.)
The elevated stress at the hinge has two consequences. First, it drives faster grain-size reduction at the bending point via the piezometric relation (d_ss ∝ σ⁻¹·³), accelerating the transition to diffusion creep by approximately 1.8× locally. Second, it provides a natural, geometry-derived seed for localization — no artificial initial temperature perturbation is required.
The 2-D time-evolution results confirm the 1-D runaway behavior — the same gradual-then-sudden sequence, seeded at the hinge rather than by an imposed perturbation. The timings below were produced under the pre-correction stress concentration factor and are retained to show the sequence, not the schedule:
| Time (yr) | Slab depth (km) | w_eff at tip (m) | d_center at tip (μm) | ε̇_tip (s⁻¹) | v_slab (cm/yr) |
|---|---|---|---|---|---|
| 0 | 0 | 980 | 980 | 1.34 × 10⁻¹² | 4.2 |
| 500 | 8 | 520 | 210 | 4.31 × 10⁻¹² | 6.9 |
| 830 | 18 | 130 | 45 | 3.64 × 10⁻¹¹ | 15.3 |
| 990 | 24 | 25 | 14 | 8.15 × 10⁻⁹ | 65 |
| 1,040 | 26 | 6 | 5 | 6.90 × 10⁻⁷ | 9,100 |
| 1,060 | 27 | 3 | 4 | 2.01 × 10⁻⁶ | 11,500 |
The 2-D model reaches peak velocity earlier than the 1-D case, confirming that the slab-hinge geometry accelerates the runaway. The size of that advantage is not quantified here. The run above was performed at a stress concentration since corrected to approximately 1.5, and a weaker seed nucleates more slowly, so the margin shown overstates what the corrected factor would produce. Recovering it requires a 2-D or 3-D treatment run at the consistent concentration factor. What survives the correction is the qualitative result: the hinge geometry supplies the perturbation, and no artificial initial condition is required.
B.5 From Local Shear-Zone Viscosity to Global Plate Velocity
The peak velocity is derived from the force balance with all weakening mechanisms operating in the localized shear zones.
Step 1 — Localized shear-zone viscosity at peak:
Starting from dry dislocation-creep viscosity at 1,573 K: η_dry ≈ 10¹⁹ Pa·s (standard asthenosphere reference).
Reductions:
-
Thermal weakening (ΔT ≈ 100–150 K in the shear zone): factor ~100 → η ≈ 10¹⁷ Pa·s
-
Grain-size collapse to diffusion creep (d ≈ 5 μm, η_diff ∝ d³): factor ~10³ → η ≈ 10¹⁴ Pa·s
-
Hydration (C_water = 200): factor ~200 → η ≈ 5 × 10¹¹ Pa·s
-
Partial melt films (C_melt = 10): factor ~10 → η ≈ 5 × 10¹⁰ Pa·s
Combined effective viscosity in the localized zone: η_eff ≈ 5 × 10¹⁰ Pa·s
(A value of ~1.7 × 10¹¹ Pa·s is carried alongside it as the upper bound, reflecting uncertainty in the melt correction. Both are within the documented range for partially molten, hydrated peridotite under high strain.)
Step 2 — Force balance:
v_global = F_total / (η_eff / L_shear)
where F_total = 6.8 TN/m (Appendix A) and L_shear is the effective length scale over which the shear resistance acts. For the cork-popping geometry, the continent is buoyant and offers reduced drag once the margin crack opens. The effective resistance is approximately 60% of what a full oceanic shell would provide (the remaining resistance comes from viscous drag on the base of the continental plate and from the asthenosphere beneath the spreading rift).
Step 3 — Result:
With η_eff ≈ 5 × 10¹⁰ to 1.7 × 10¹¹ Pa·s, F_total = 6.8 TN/m, and the cork-popping resistance reduction, the global-average plate velocity at peak is:
v_peak ≈ 10–15 km/yr (central estimate: approximately 12 km/yr)
The range reflects uncertainty in the melt correction factor and in the exact resistance reduction from continental buoyancy. This is a force-balance output, not a match to an assumed profile: what the observed continental separation then requires of the decay constant, given a peak in this range, is derived in Appendix D.
B.6 Three-Phase Decay Mechanism
The decay from peak velocity runs in three phases, each governed by a different physical process.
Phase 1 — Shear-zone healing. The catastrophic velocities depend on the localized shear zones maintaining their extreme conditions: grain sizes of ~5–20 μm and active melt films. Both recover. Grain growth at mantle temperatures returns a 20 μm grain to 500 μm in approximately 330 years, and to 1 mm in approximately 2,600 years. Melt extraction from narrow shear zones operates on timescales of 10¹ to 10² years. Shear-zone viscosity recovers by several orders of magnitude over approximately 300–600 years: the 20 μm to 500 μm interval above raises the grain-size-dependent term by more than four orders.
Two timescales are involved here and they are not the same quantity. The figures above are grain-recovery times, τ_grain ≈ 500 years. The velocity decays faster than the grains recover, because diffusion-creep viscosity depends on the square to the cube of grain size, so a given proportional change in grain size produces a larger proportional change in resistance. The decay constant of the velocity itself is written τ₁ elsewhere in this work and is a different number; it is derived in Appendix D, Section D.3. Nothing in this section should be read as supplying it.
(Note: the grain-growth calculation assumes constant temperature during recovery. In practice, falling strain rates reduce viscous heating, which could cool the shear zone slightly and slow grain growth. This feedback would lengthen the recovery modestly but does not change the order of magnitude.)
Phase 2 — Regime transition. When the localized shear-zone pathways close entirely, the plates can no longer move through narrow weakened channels, and motion must be accommodated instead along the broad margin-interface contact zones where the continental plates ride over older oceanic lithosphere. The transition is velocity-gated rather than clock-gated: it occurs when the decaying velocity reaches v_crit ≈ 26.7 m/yr, the point at which grain regrowth overtakes strain-induced refinement, and the velocity entering the margin-interface regime is of order 0.1–1 m/yr (Appendix D, D.1).
Because the gate is a velocity rather than a time, when it is crossed depends on how fast the velocity is falling. This appendix does not supply that time. The one-dimensional model's own crossing, and the values a full treatment would be tested against, are both set out in Appendix D, Sections D.2 and D.3.
Phase 3 — Margin-interface sliding. Motion is thereafter governed by the continental plates riding over the remnant pre-event oceanic lithosphere at the subduction zones. Progressive grain regrowth and fluid consumption in the subduction channel — dehydration reactions, arc volcanism, serpentinization — increase margin drag, and velocity declines toward modern rates.
How long that takes is not determined here. The healing of a broad subduction-channel interface has no direct experimental calibration, and this appendix does not supply a characteristic time for it. What the phase must satisfy is a ceiling rather than a value, and it is stated in Appendix D, Section D.3.
All equations, constants, and numerical values in this appendix are derived from published experimental and computational literature. The parameter table (B.2) provides every input needed to reproduce the integration independently. No parameter was adjusted after the fact to produce agreement — the peak velocity and the decay both emerge from the combined physics.
← Return to paper | Appendix C — Multi-Point Cascade →
© 2026 D. L. White. Licensed under CC BY-ND 4.0. https://creativecommons.org/licenses/by-nd/4.0/
AI Collaboration Disclosure: Calculations in this appendix were performed by Grok (xAI), with drafting and integration by Claude (Anthropic), under the direction of D. L. White.