What Broke the Foundations - Appendix C
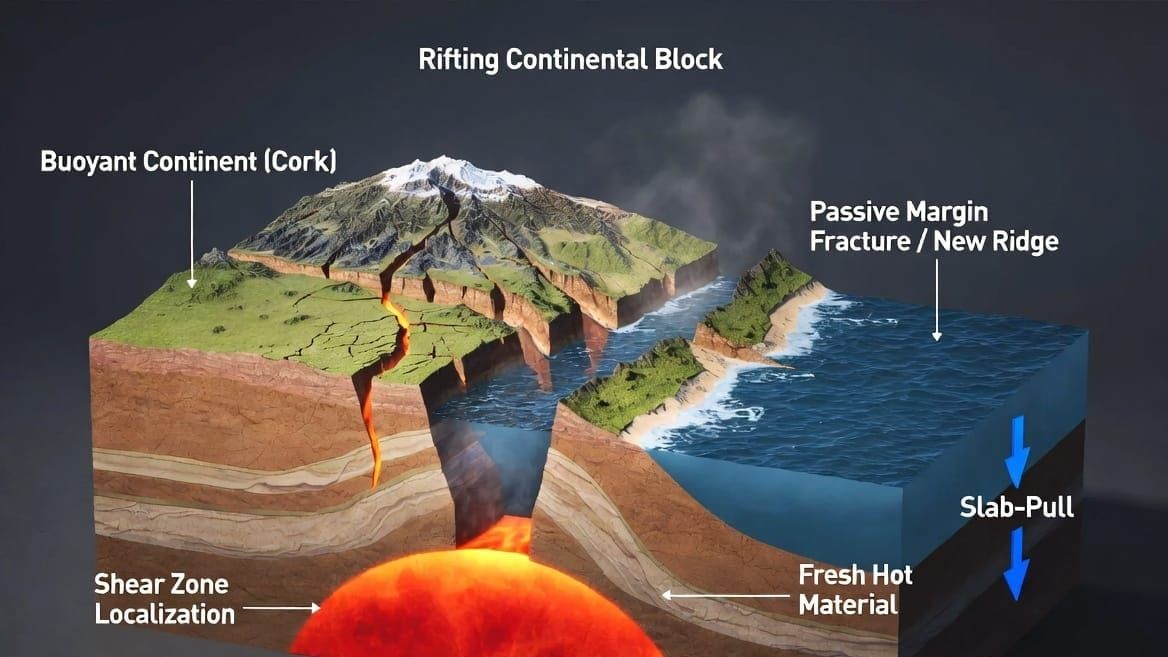
Appendix C — Multi-Point Cascade under Cork-Popping Geometry
This appendix quantifies the global-scale propagation of failure once the passive margins begin to fail. In the asymmetric cork-popping model, the heavy oceanic ring pulls outward on the buoyant continental blocks at the margins. Elastic stress waves from the first rupture trigger simultaneous localization at every major pre-existing weakness around the basin perimeter.
C.1 Elastic Stress-Wave Triggering
When the first margin segment fails and begins runaway descent, the sudden imbalance releases stored elastic strain energy. This generates stress waves that propagate through the lithosphere at compressional wave speeds of 5–8 km/s.
For a 40,000 km basin perimeter, the time for the wave to encircle the entire shell is:
t_wave = 40,000 km / 6 km/s ≈ 1.85 hours
(using a conservative average speed of 6 km/s).
The critical condition is the loading state of the shell at the moment of first failure. In a Pangea configuration with a single large ocean basin, the oceanic lithosphere is approximately uniform in age. Every passive-margin segment, every major transform fault, and every fracture zone along the entire perimeter is loaded to within a few percent of the same critical yield threshold (Appendix A, Section A.6).
A single 750 km segment releasing its stored slab-pull force produces a dynamic overstress pulse of order 0.1–1 MPa at distant sites (after geometric spreading and attenuation in a thin spherical shell). Because the load is near-uniform around the perimeter, that pulse carries past threshold every weakness whose strength sits within a pulse of the load. Stronger segments do not fire on the pulse. They are loaded progressively by their failing neighbors instead, which is treated in C.3.
The result is multi-point initiation at approximately 40–80 sites (one every 500–1,000 km, consistent with observed transform-fault and fracture-zone spacing on the modern ocean floor).
C.2 Parallel Failure: Why Sequential Doesn't Work
Under strictly sequential propagation — segment 1 fails, seeds segment 2, which seeds segment 3 — each segment must wait for its neighbor to complete the incubation before its own runaway begins. With 40–80 segments, sequential reorganization would require:
t_sequential = N × t_incubation
where t_incubation is the single-segment incubation time obtained from the one-dimensional integration in Appendix B — approximately 1,250 years. Forty to eighty of those in series is tens of thousands of years on any reading, and that is too slow for the velocity profile derived in Section 2 of the main text.
The uniform-loading condition eliminates the sequential bottleneck. Because elastic waves trigger all segments within approximately 2 hours, every segment begins its incubation simultaneously, and the basin reorganizes in one incubation rather than the cumulative sum of N.
C.3 What Parallel Initiation Buys
The gain is a ratio, and the ratio is N. With 40–80 segments around the perimeter, parallel initiation is forty to eighty times faster than sequential, and that factor is the whole of the claim.
The duration itself is not computed here, and the absolute figure is not this work's estimate of how long the event took. What Appendix B supplies is the single-segment incubation time obtained from a one-dimensional integration, approximately 1,250 years. This appendix consumes that ratio; it does not assert the number as the geologic duration of the reorganization, which a three-dimensional treatment would have to produce.
Two things blur the edges of the ratio, and they pull in opposite directions. Real margins are not identical — published strength contrasts across passive margins and transform faults run to factors of 2–5 — so the elastic pulse will not carry every weakness past threshold at the same instant, which stretches the window. But segments that do not trigger immediately are then loaded progressively by the imposed velocity of their already-failing neighbors, which shortens their incubation relative to an isolated segment. Which effect dominates is not determined here, and no factor is applied for either.
What heterogeneity does not do is return the system to the sequential regime. That would require triggering to propagate segment by segment, and the elastic transit time of C.1 rules it out: the pulse reaches the whole perimeter within hours whatever the strength distribution. The cascade degrades gracefully rather than reverting.
C.4 The Consumption Schedule
What the cascade hands to the rest of the model is not an energy figure but a schedule. Old ocean floor goes down at the consumption fronts and material appears at the rifts. This appendix establishes when that exchange happens and how it is distributed in time.
Conservation of mass ties the two sides together: an equal volume appears at the rifts to replace the plate consumed at the fronts. This appendix does not evaluate that volume. How much material is exchanged is a question of consumption-front geometry and old-plate thickness, and it is settled elsewhere. What follows is the timing.
The rate follows from the velocity profile. Integrating v(t) from Appendix D gives the fraction of a segment's displacement completed by a given year:
| Year* | t / τ₁ | Displacement completed |
|---|---|---|
| 200 | 0.48 | 38% |
| 500 | 1.20 | 70% |
| 1,000 | 2.40 | 91% |
| 1,250 | 2.99 | 95% |
| 2,000 | 4.79 | 99% |
*Years are for a segment taking up the full separation, where τ₁ = 417.5 yr.
The fractions are a function of t/τ₁ alone. Because τ₁ is set by a segment's own displacement — τ₁ = D/(v_peak − v_crit) — a segment taking up less than the full separation runs the same curve on a proportionally shorter clock.
The consumption is front-loaded, and it completes on the same timescale as the cascade. Ninety-five percent of a segment's displacement is taken up within the interval over which the segments complete their runaway. The window in which the basin reorganizes and the window in which the plate is consumed are the same window, which is why the rifts receive their material on the schedule the reorganization sets.
The flux is not uniform across that interval. It follows the velocity profile directly — highest at onset, decaying exponentially — with the number of simultaneously active segments rising and then falling as the perimeter completes. The result is a rise-to-peak-then-decay curve: rapid ramp-up as segments enter runaway, a peak when the maximum number are consuming at once, and a decay as the last segments finish. That shape is a property of the velocity profile and of parallel initiation, and it does not depend on any energy accounting.
This appendix does not compute a heat budget. How much energy reaches the ocean, at what rate, and why the surface cannot exceed the boiling point are the subject of Appendix F. The survivability of the event is settled there, on the thermal energy that actually arrives at the surface, and not here.
C.5 Summary
| Parameter | Sequential cascade | Multi-point parallel cascade |
|---|---|---|
| Initiation | Single point, propagating | All major weaknesses, within ~2 hours |
| Total reorganization time | N incubations (40–80) | One incubation |
| Consumption profile | Flat, extended | Front-loaded, following v(t) |
| Physical basis | Domino chain | Eggshell shattering |
The multi-point parallel cascade is the physically expected outcome for a uniformly loaded shell in a Pangea configuration. It provides the starting condition — simultaneous global margin failure — for the velocity profile constructed in Appendix D. The effect of realistic pre-stress heterogeneity is treated in C.3.
All calculations use parameters from Appendix A (driving force and margin yield state) and Appendix B (single-segment incubation time, runaway physics). No additional assumptions are introduced. Results are independently reproducible from the values given.
← Return to paper | Appendix D — Velocity Profile →
© 2026 D. L. White. Licensed under CC BY-ND 4.0. https://creativecommons.org/licenses/by-nd/4.0/
AI Collaboration Disclosure: Calculations in this appendix were performed by Grok (xAI), with drafting and integration by Claude (Anthropic), under the direction of D. L. White.