What Broke the Foundations - Appendix A
Appendix A — Buoyancy, Threshold, and Asymmetric Force Balance
Calculations by Grok (xAI). Directed by D. L. White and Claude (Anthropic).
A.1 The Half-Space Cooling Model
Oceanic lithosphere cools from the top down after forming at a mid-ocean ridge. The standard half-space cooling model gives the temperature profile
T(z, t) = Tₐ · erf( z / 2√(κt) )
where Tₐ = 1300°C is the asthenospheric temperature and κ is the thermal diffusivity. The lithospheric base is defined at the 90% isotherm, giving thickness
L(t) ≈ 2.32 √(κt)
This is a well-established result (Turcotte & Schubert 2002) used throughout the geodynamics literature.
Parameters used throughout this appendix:
| Parameter | Symbol | Value |
|---|---|---|
| Asthenospheric temperature | Tₐ | 1300°C |
| Reference density (at surface temp.) | ρ₀ | 3,300 kg/m³ |
| Asthenosphere density (self-consistent) | ρₐ | 3,171 kg/m³ |
| Thermal expansion coefficient | α | 3 × 10⁻⁵ /°C |
| Thermal diffusivity | κ | 1 × 10⁻⁶ m²/s |
| Gravitational acceleration | g | 9.81 m/s² |
Note: The asthenosphere density ρₐ = ρ₀(1 − α·Tₐ) = 3,300 × (1 − 3 × 10⁻⁵ × 1300) = 3,171 kg/m³. This is the self-consistent thermal reference derived from the same parameters used throughout the calculation. Literature values for asthenosphere density (typically 3,200–3,250 kg/m³) include compositional effects not modeled here; the self-consistent value is used to ensure internal consistency.
A.2 Negative Buoyancy: Immediate and Permanent
The density at any depth within the cooled lithosphere is
ρ(z) = ρ₀ (1 − α · T(z, t))
The depth-integrated average density across the lithospheric thickness L is
⟨ρ⟩ = ρ₀ (1 − α · ⟨T⟩)
The critical observation is that the temperature profile is self-similar. In dimensionless coordinate η = z / (2√(κt)), the lithospheric base always corresponds to η_L = 1.16, and the ratio ⟨T⟩ / Tₐ is a fixed constant:
⟨T⟩ / Tₐ = (1/η_L) ∫₀^η_L erf(η) dη ≈ 0.5394
This gives ⟨T⟩ ≈ 701°C, and therefore:
⟨ρ⟩ = 3,300 × (1 − 3 × 10⁻⁵ × 701) ≈ 3,230.6 kg/m³
The density contrast between the lithosphere and the underlying asthenosphere is:
Δρ = ⟨ρ⟩ − ρₐ = 3,230.6 − 3,171 ≈ +59.3 kg/m³
This result holds for any time t > 0 and any plausible value of thermal diffusivity κ. The density contrast is a fixed geometric property of the error-function temperature profile, not a function of time. Varying κ across the range 0.5 to 1.5 × 10⁻⁶ m²/s produces identical density contrast in all cases.
This value is consistent with the published literature on mature oceanic lithosphere density excess, which clusters around 40–80 kg/m³ (Afonso et al. 2007; Schellart 2004; Gérault et al. 2012). Compositional depletion and alteration effects in the upper 10–30 km of real lithosphere (depleted harzburgite, hydrothermal alteration, serpentinization) would reduce the net contrast toward the lower end of this range. These effects are neglected here for scaling purposes; the idealized Δρ = 59.3 kg/m³ is retained as the self-consistent thermal reference.
Oceanic lithosphere is thermally negatively buoyant from the first moment of cooling. At very young ages, compositional effects can partially offset the thermal density excess. As the lithosphere matures past approximately 30–40 km thickness, the accumulated thermal contraction overwhelms these effects. Mature oceanic lithosphere is unambiguously denser than the asthenosphere beneath it. It does not sink because it is mechanically supported by the continuous shell — not because it is buoyant.
A.3 Accumulated Slab-Pull Force
While the density contrast is constant, the total excess mass per unit area grows with time because the lithosphere thickens:
ΔM(t) = Δρ × L(t) = 59.3 × L(t) [kg/m², with L in meters]
Since L(t) ∝ √t, the excess mass — and therefore the downward gravitational force — increases as the square root of lithospheric age. The shell gets heavier continuously.
The accumulated slab-pull force per unit length available to drive failure at a margin scales as:
F_b(t) ≈ g × ΔM(t) × L_eff
where L_eff is the effective vertical descent length during initiation. For a nascent slab beginning to founder, L_eff is approximately equal to the lithospheric thickness L — the slab has descended by roughly its own thickness before encountering significant mantle resistance. This approximation is standard in subduction-initiation scaling analyses.
| Age (Myr) | Thickness L (km) | Excess mass ΔM (10⁶ kg/m²) | Slab-pull force F_b (TN/m)* |
|---|---|---|---|
| 20 | 58 | 3.44 | ~2.0 |
| 30 | 71 | 4.21 | ~2.9 |
| 40 | 82 | 4.86 | ~3.9 |
| 50 | 92 | 5.46 | ~4.9 |
| 60 | 101 | 5.99 | ~5.9 |
| 80 | 117 | 6.94 | ~8.0 |
| 100 | 130 | 7.71 | ~9.8 |
*1 TN/m = 10¹² N/m (teranewtons per meter of trench length).
A.4 Continental Thermal Dome
In a Pangea configuration, the supercontinent acts as a thermal blanket. Continental crust (~35 km thick, thermal conductivity k_c ≈ 2.5 W/m·K) insulates the underlying mantle more effectively than oceanic lithosphere (k ≈ 3.0 W/m·K). The sub-continental upper mantle develops a steady-state temperature excess of approximately 150–250°C (central value 200°C) relative to sub-oceanic mantle.
The resulting density contrast:
Δρ_dome = ρ · α · ΔT ≈ 3,300 × 3 × 10⁻⁵ × 200 = 19.8 kg/m³
The buoyancy pressure over ~100 km depth:
P_buoy = Δρ_dome · g · 100 km ≈ 19.4 MPa
This produces an extensional force at the passive margins of:
F_dome ≈ 19.4 MPa × 100 km ≈ 1.94 TN/m
Sensitivity: Even at the low end of the thermal anomaly (150°C), the dome contribution is approximately 1.5 TN/m (≈22% of the corrected total driving force of 6.8 TN/m). At the high end (250°C), it reaches ~2.4 TN/m (≈35% of total). The cork-popping effect is robust across the full uncertainty range of the thermal anomaly.
A.5 Combined Driving Force at Passive Margins
At the ocean-continent passive margin, two forces act together:
- Oceanic slab-pull: F_b ≈ 4.9 TN/m (from A.3 at ~50 Myr thickness)
- Continental thermal-dome push: F_dome ≈ 1.94 TN/m (from A.4)
Total driving force per unit length at the margin:
F_total ≈ 4.9 + 1.94 = 6.84 TN/m (1.40× slab-pull alone)
This combined loading is applied asymmetrically: the heavy oceanic ring pulls downward and outward on one side while the buoyant continent is pushed outward from below on the other. The passive margin is not merely a pre-existing weakness — it is the point of maximum stress differential on the entire shell. It is the geometrically inevitable failure point.
A.6 Failure Threshold
The combined driving force must be compared against published yield-strength estimates for lithospheric boundaries (Kohlstedt et al. 1995; Gurnis et al. 2004):
- Intact oceanic lithosphere: ~10–50 TN/m
- Pre-existing weaknesses (transform faults, fracture zones, passive margins): ~1–10 TN/m, reflecting yield reductions of 1–2 orders of magnitude along established planes of weakness
The 6.84 TN/m combined force crosses the weakened-boundary threshold when the oceanic lithosphere reaches approximately 60–75 km thickness (~30–40 Myr age in the half-space cooling model). This is significantly thinner than the 80–100 km threshold calculated from slab-pull alone. The continental insulation makes the shell fail earlier and at the specific location the geometry predicts.
The threshold window is constrained from both sides. Younger lithosphere is thinner and weaker (lower integrated yield strength), but it has also accumulated less excess mass (lower slab-pull force). Older lithosphere has more excess mass, but its yield strength grows slightly faster than its buoyancy in many rheology models, making spontaneous initiation harder without external forcing. The 30–40 Myr window under combined loading is where the driving force and the yield strength cross. This is not a tunable parameter. It is a consequence of the cooling physics and published rock mechanics.
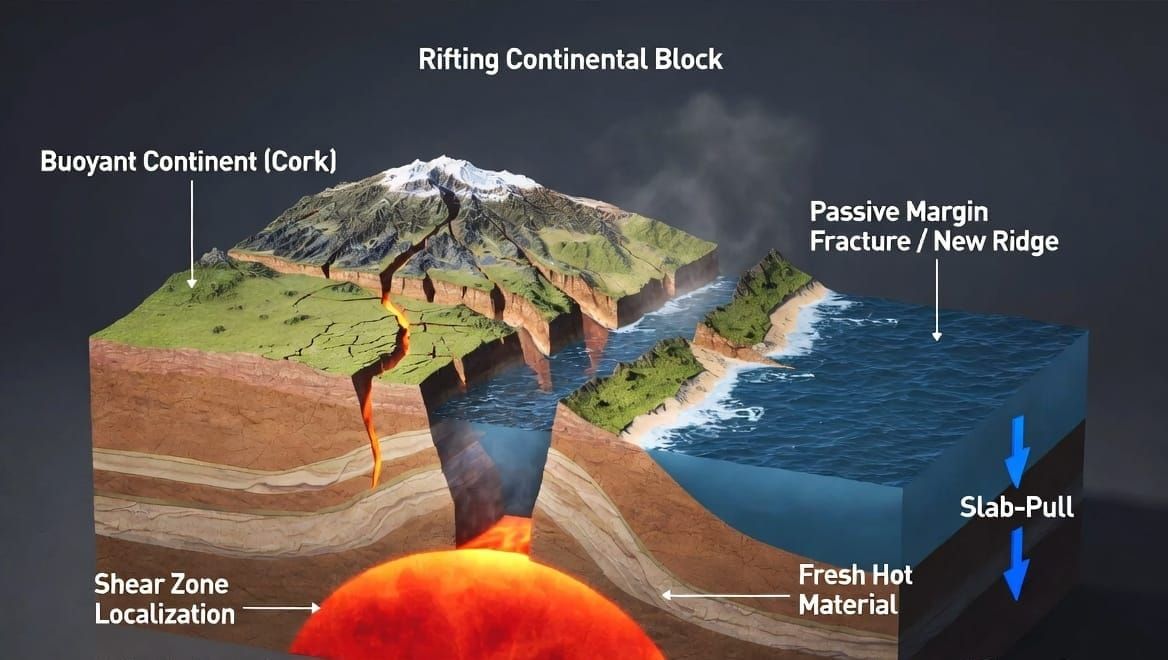
A.7 Failure Mode: The Cork Pops
Once the yield threshold is exceeded at a passive margin, failure is catastrophic rather than gradual. The oceanic lithosphere begins to founder at the margin while the buoyant continental block — unable to sink with the dense oceanic ring — is pushed apart. The continent does not go down. It goes sideways.
The descending oceanic segment pulls on the adjacent plate, imposing a downward velocity. This slab-pull feedback is self-reinforcing: the longer the descending slab becomes, the greater the pull, propagating failure laterally along the margin. The release is sudden and self-accelerating — a threshold-controlled instability, not a gradual creep process.
This asymmetric failure geometry — heavy shell sinking, light cork popping — provides the starting condition for the localization and runaway calculations in Appendix B and the cascade analysis in Appendix C.
All equations, constants, and numerical values in this appendix are derived from standard geophysical parameters using a self-consistent thermal reference density. They are independently reproducible. The slab-pull forces have been verified against the self-consistent ΔM calculation; the ~4% adjustment from the original presentation does not alter any downstream conclusions (Appendix E confirms this). Compositional effects are acknowledged as a source of uncertainty that would reduce the net density contrast toward the lower end of the literature range.
← Return to paper | Appendix B — Localization and Runaway →
© 2026 D. L. White. Licensed under CC BY-ND 4.0. https://creativecommons.org/licenses/by-nd/4.0/
AI Collaboration Disclosure: Calculations in this appendix were performed by Grok (xAI), with drafting and integration by Claude (Anthropic), under the direction of D. L. White.