How Did the Rhino Cross the Sea?
A catastrophist alternative to the North Atlantic Land Bridge hypothesis. Part One of the Diversification Series
How Did the Rhino Cross the Sea?
A Catastrophist Alternative to the North Atlantic Land Bridge
Hypothesis
Meaning Books, March 2026
Part One of the Diversification Series
Disclaimer: This paper was developed collaboratively between Claude
(Anthropic) and D. L. White. White directed the inquiry, posed the core
questions, and introduced the propositions. Claude provided technical
data, identified physical mechanisms, performed calculations, and
co-developed the reasoning chain. Neither party endorses all conclusions
as settled---the intent is to demonstrate that the logic holds, not that
the case is closed.
Abstract
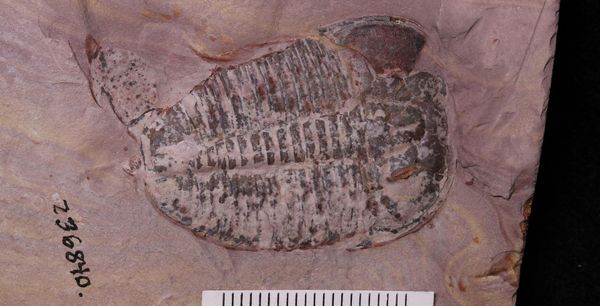
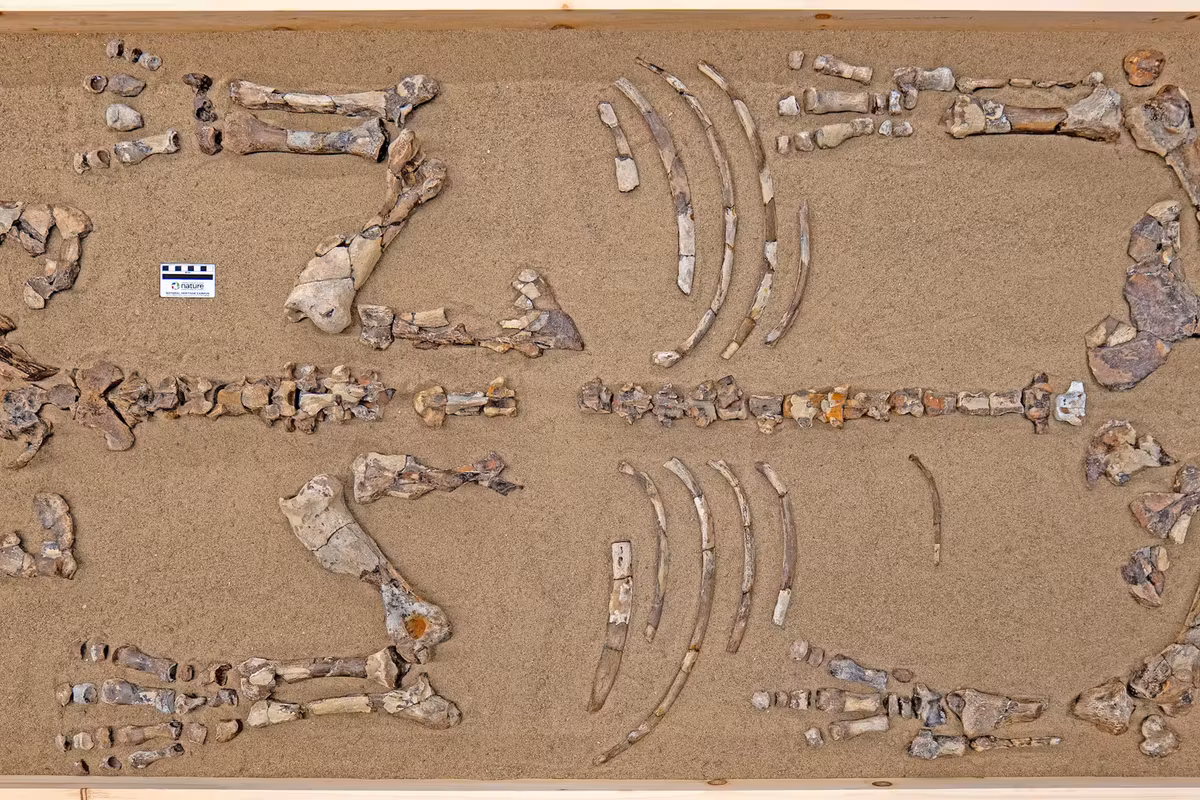
In October 2025, researchers from the Canadian Museum of Nature
announced the discovery of Epiaceratherium itjilik, a 75%-complete
rhinoceros fossil recovered from Haughton Crater on Devon Island,
Nunavut. The specimen is dated to approximately 23 million years ago and
identified as the northernmost rhino ever found. Its closest relatives
are European, not Asian, which poses a direct bio-geographic problem:
how did a European-lineage animal reach the Canadian High Arctic across
an ocean that---by conventional reckoning---had already separated the
two continents for over 30 million years?
The researchers proposed that the North Atlantic Land Bridge persisted
roughly 20 million years longer than previously thought. No independent
geological evidence supports this revision; it is inferred entirely from
the fossil it is meant to explain.
This paper presents an alternative framework. Beginning from the
physical anomalies the fossil presents, and introducing a sequence of
clearly identified propositions, it constructs a catastrophist model
that resolves multiple independent problems simultaneously---without
requiring any change to known physics. An order-of-magnitude energy
budget analysis is included to demonstrate that the model falls within
the plausible zone. The paper concludes with an open question the model
necessarily raises.
1. The Evidence on the Table
Three features of the discovery require explanation:
The animal's lineage. Phylogenetic analysis (the reconstruction of
evolutionary family trees from physical and genetic traits) places E.
itjilik among European rhino species, with no identified Asian
intermediates. A Bering land bridge route from Europe through Asia to
North America lacks supporting evidence in the family tree.
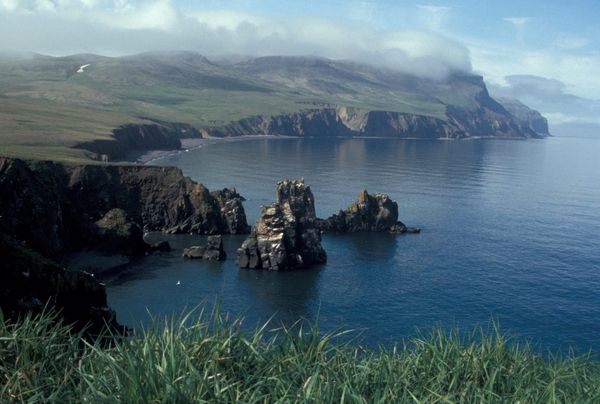
The environment. The fossil was found alongside temperate forest
species---rabbits, shrews, swans, a proto-seal---at a location currently
1,000 kilometers north of the Arctic Circle. The Arctic at 23 million
years ago, per conventional paleoclimate models, was warmer than today
but still required substantial climate modeling to support this
ecosystem at 75°N latitude.
The proteins. Researchers recovered intact proteins from the
animal's tooth enamel, dated to approximately 21 million years
old---roughly ten times older than the oldest recovered ancient DNA. The
researchers described this as groundbreaking. Protein degradation is a
chemical process governed by temperature, hydration, and time. At a
compressed true age of roughly 5,000 to 10,000 years under cold Arctic
burial conditions, published hydrolysis kinetics for enamel proteins
predict survival well within observed ranges; the 21-million-year
conventional age is the anomaly that requires explanation, not the
protein itself.
The published explanation---an extended North Atlantic Land
Bridge---addresses only the first of these three features. It does not
account for the environmental anomaly or the protein preservation. And
the bridge itself is inferred from the fossil rather than from
independent geological data, which constitutes circular reasoning unless
corroborated.
2. Methodological Observation: Radiometric Calibration
The 23-million-year age assignment derives from radiometric dating of
the Haughton Crater lake deposits, cross-referenced with
biostratigraphic correlation (the fossil's morphology and strata match
rhino fossils of similar assigned ages worldwide).
Both methods ultimately depend on radiometric calibration. The
stratigraphic column---the worldwide sequence of layered rock and fossil
deposits that geologists use as their master timeline---has its absolute
dates anchored to radiometric measurements. This means the two lines of
evidence are not fully independent; they share a common foundation.
Radiometric dating methods (particularly K-Ar and Ar-Ar) depend on
assumptions about initial conditions at the time of rock
formation---specifically, that no daughter product (e.g., argon) was
present when the rock solidified. When these methods are tested against
rocks of historically known age---lava flows from observed volcanic
eruptions---the results consistently overestimate the true age,
sometimes by orders of magnitude. The documented cause is excess argon:
argon trapped in the rock at formation that the model assumes is absent.
Key observation:
The physics of radioactive decay is well-established and not in dispute.
Decay constants have been measured with high precision in laboratory
settings. The vulnerability is not in the decay rates but in the assumed
initial conditions. If initial daughter product concentrations were
different from what models assume, every calculated age shifts---without
requiring any change to nuclear physics. This is the documented failure
mode in known-age samples, and it always errs in the same direction: too
old.
Modern Ar-Ar step-heating protocols were developed specifically to
address this problem and represent a genuine improvement over earlier
K-Ar methods. The protocol heats a sample incrementally and measures the
argon released at each temperature step. The rationale is that excess
argon---trapped in crystal inclusions, grain boundaries, or loosely
bound sites---releases at different temperatures than radiogenic argon
locked in the crystal lattice. If several consecutive temperature steps
produce the same apparent age, that plateau is interpreted as the true
age, with the contamination burned off at the edges.
The protocol works when excess argon is spatially segregated within the
crystal---concentrated in specific sites that release at specific
temperatures while the radiogenic signal releases at different
temperatures. But if excess argon is uniformly distributed throughout
the crystal lattice---incorporated into the mineral structure during
crystallization rather than trapped in inclusions after the fact---then
every temperature step releases a proportional mix of radiogenic and
excess argon. The plateau is flat, looks clean, and produces a wrong
answer that the method has no internal means to detect. A flat plateau
does not prove the absence of excess argon. It proves either its absence
or its uniform distribution. The method cannot distinguish between those
two cases. This is a recognized limitation in the geochronology
literature, not a novel objection.
A deeper problem is structural. Independent validation of any
radiometric method requires samples whose true age is known from
non-radiometric evidence. The only such samples are rocks from
historically observed volcanic eruptions---Vesuvius in 79 AD, Mt. St.
Helens in 1980, Hualalai in 1801, Ngauruhoe in the 1950s. But
potassium-40 has a half-life of approximately 1.25 billion years. In the
centuries since these eruptions, the fraction of K-40 that has decayed
is on the order of 10⁻⁷. The radiogenic argon produced in that time is
vanishingly small relative to atmospheric contamination and any excess
argon trapped during crystallization. The true signal is buried in the
noise.
This is why defenders of the method dismiss results on young volcanic
samples---the samples are too young for the radiogenic signal to rise
above background. That objection has technical merit on its own terms.
But it reveals a validation gap that is structural, not incidental.
Samples young enough to have historically documented eruption dates are
too young for the method to produce a meaningful radiogenic signal.
Samples old enough for the radiogenic signal to be measurable do not
have independently known ages. There is no sample on Earth that is
simultaneously old enough to accumulate measurable radiogenic argon and
young enough to have a historically verified formation date. The two
requirements are mutually exclusive at current measurement precision---a
consequence of the half-life being 1.25 billion years and recorded human
history being roughly 5,000 years. The window does not overlap. The
method is untestable at the ages where it is actually used, and the ages
where it is testable reveal a consistent failure mode whose magnitude at
older ages cannot be characterized.
The standard response is that initial argon does not matter at deep
time---that for a sample genuinely millions of years old, the
accumulated radiogenic argon is so large that any excess trapped at
formation is de minimis by comparison. This argument sounds decisive but
is circular. The claim that initial argon is negligible relative to the
radiogenic signal assumes that the radiogenic signal is large, which
assumes that the sample is actually millions of years old---the
conclusion being used as a premise. You measure a quantity of Ar-40 in a
rock. You need to determine how much is radiogenic versus how much was
present at formation. The de minimis argument says the excess is small
relative to the radiogenic portion. But the radiogenic portion is not
measured independently---it is inferred by assuming the age is old,
which makes the excess look small, which validates the age. If the true
age is compressed---thousands rather than millions of years---the math
inverts completely. Essentially all the measured argon is either
atmospheric or excess, and the radiogenic contribution is the part that
is de minimis. Which component is negligible depends entirely on which
timescale is true, and that is the very question at issue. Neither side
can use its own assumed timescale to dismiss the other's without begging
the question.
The validation gap and the de minimis circularity are two halves of the
same problem. The first establishes that independent verification is
structurally impossible. The second establishes that the fallback
argument---that verification is unnecessary because the initial
conditions wash out at deep time---assumes its own conclusion. Together
they close the escape route: the method cannot be tested where it can be
verified, and the problem cannot be dismissed where it cannot be
verified, because the dismissal is circular.
A rigorous recalibration study---characterizing the statistical
distribution of errors in known-age samples and applying that error
profile to samples of unknown age---has not been conducted. Such a study
could only produce one of two outcomes: compressed ages or confidence
intervals too wide to support precise dating. Either result would
challenge foundational assumptions across multiple disciplines
simultaneously, which may explain why the study has not been attempted.
3. The Propositions
What follows is a sequence of propositions, each introduced to resolve a
specific physical problem. Each is clearly labeled. The reasoning that
connects them is presented separately from the propositions themselves.
Proposition 1: The radiometric timeline is significantly compressed.
If the systematic overestimation observed in known-age samples reflects
a general condition---excess daughter products in formation
environments---then conventional geological ages are too old. The
compression applies uniformly across the stratigraphic column,
preserving all relative relationships (this rhino is still
contemporaneous with its European relatives) while reducing absolute
ages.
What this resolves:
At younger true ages, the Atlantic Ocean is narrower. Continental
positions are closer to their pre-rift configuration. The physical
distance between Europe and North America decreases proportionally with
the degree of compression.
Proposition 2: A global hydraulic catastrophe with simultaneous tectonic and volcanic activity produced the bulk of the sedimentary record in a compressed timeframe.
Rather than slow accumulation over millions of years, the majority of
the stratigraphic column was deposited rapidly under catastrophic
hydraulic conditions. Hydraulic sorting produces layered deposits by
particle density, size, and hydrodynamic properties---not by time.
Organisms sort roughly by habitat elevation and mobility: marine
organisms lowest, slow-moving land animals in the middle, mobile animals
and birds highest. This general pattern matches the fossil column's
broad structure.
A clarification is necessary here. This proposition claims that the
catastrophe produced the bulk of the record, not its entirety. The
fossil column exhibits specific, repeatable biostratigraphic
zones---consistent assemblages of species appearing in the same relative
order across multiple continents---with a precision that exceeds what a
single hydraulic event would produce. A flood sorts by physical
properties. It does not independently reproduce the same species
communities in the same order on three continents.
This precision is better explained by recognizing that organized
ecosystems existed before the catastrophe and produced their own fossil
deposits through normal processes during a compressed pre-catastrophe
timeline. The catastrophe then disrupted, transported, and redeposited
this existing record---preserving much of the original relative ordering
because the deposits were already stratified by location and elevation
on the pre-catastrophe landscape. The broad hydraulic sorting pattern is
the catastrophe's signature. The fine biostratigraphic structure is the
pre-existing ecology's signature, carried along for the ride.
What this resolves:
The stratigraphic correlation of rhino fossils worldwide becomes a
record of deposition under similar conditions within a compressed
timeframe, with the fine structure reflecting pre-existing ecological
communities rather than vast geological ages. The relative ordering is
preserved. The time axis is compressed.
Proposition 3: Pre-catastrophe Earth had relatively uniform, low-relief topography.
If pre-catastrophe topography lacked the extreme relief of the modern
earth---no Himalayas, no Mariana Trench---the existing ocean volume,
redistributed over a topographically smooth Earth, would cover the
entire surface to a significant depth. Estimates for a topographically
smoothed Earth yield global ocean depths on the order of 8,000--9,000
feet. No additional water source is required.
The catastrophe itself---rapid plate collision, subduction, and crustal
deformation---created the modern topographic extremes. Mountain ranges
were thrown up; ocean basins were torn open. Post-catastrophe, water
drained from continental surfaces into newly formed deep basins,
exposing the landmasses we see today.
What this resolves:
The water volume problem for global inundation. Additionally, low-relief
pre-catastrophe topography means fewer barriers to terrestrial
migration. The rhino's European relatives are not separated by an ocean.
They are neighbors on a connected, walkable landmass. This proposition
also establishes the conditions for Proposition 4.
Proposition 4: Pre-catastrophe Earth's low topographic relief and unobstructed circulation produced a substantially reduced pole-to-equator temperature gradient, sufficient for temperate ecosystems at high latitudes.
The primary driver of the reduced temperature gradient is the topography
established in Proposition 3. Modern Earth's extreme temperature
gradients are largely products of its topography---mountain ranges
deflect jet streams, create rain shadows, and channel ocean currents
into narrow gyres. Deep ocean basins isolate circulation patterns.
Remove these features and you remove the primary mechanisms that
concentrate equatorial heat and produce polar cold. Broad, unobstructed
ocean and atmospheric circulation distributes thermal energy far more
evenly from equator to poles---not perfectly uniformly, since the poles
still receive less solar energy per unit area than the equator, but
sufficiently to support temperate ecosystems at latitudes where they
cannot exist today. The claim is not zero gradient. It is a dramatically
flattened one.
A supplementary contributor is elevated atmospheric humidity---a natural
and physically stable consequence of a warmer planet. The relationship
is governed by the Clausius-Clapeyron equation: for every degree Celsius
of warming, the atmosphere holds approximately 7% more water vapor
before condensation occurs. A planet with significantly reduced
topographic relief and warmer average temperatures holds more moisture
distributed throughout a deeper atmospheric column, because the
condensation ceiling---the tropopause---is higher.
This distributed humidity provides a modest additional greenhouse effect
without the fatal thermal consequences of a discrete vapor canopy. It is
not a shell or a layer---it is the natural equilibrium state of a warm
atmosphere, governed by the same physics that operates today, scaled up.
The hydrological cycle is fully preserved: evaporation, convective
uplift, condensation, and precipitation all function normally, with
higher throughput at every stage.
During the catastrophe, rapid cooling of the upper atmosphere by
volcanic aerosols lowers the condensation ceiling. The distributed
moisture precipitates out progressively---sustained, global rainfall
over an extended period as conditions change. Not a single catastrophic
dump, but a continuous wringing-out that contributes precipitation from
above while oceanic and subterranean water provide the primary
inundation volume.
What this resolves:
The temperate Arctic forest ecosystem associated with the rhino fossil,
without requiring exotic paleoclimate models, different continental
positions, or a thermally unstable atmospheric structure. The
topographic mechanism alone---unobstructed circulation on a low-relief
planet---produces the reduced gradient that temperate high-latitude
ecosystems require. The elevated humidity provides a modest additional
greenhouse contribution but is not the primary driver. The mechanism is
freshman-level atmospheric physics applied to a planet with different
topography.
Proposition 5: The catastrophe's thermal output was managed by water acting simultaneously as lubricant, buffer, and heat engine.
Rapid plate movement generates enormous mechanical heat---a well-known
and serious objection to catastrophist models. Previous attempts to
address this problem, including the RATE project's accelerated nuclear
decay proposal, have acknowledged the heat problem without resolving it.
The framework presented here identifies a multi-vector solution
intrinsic to the catastrophe's own conditions. A detailed
order-of-magnitude energy budget is provided in Appendix A.
Heat reduction at the source:
The single most important variable in the energy budget is fault zone
lubrication. Laboratory measurements of rock friction show that water at
fault boundaries reduces shear stress by approximately 85%---from
roughly 100 MPa for dry rock to roughly 15 MPa for hydrated fault zones.
This is measured physics, not speculation. Under conditions of global
inundation, water is necessarily present at every active plate boundary.
The catastrophe's own conditions prevent the worst-case heat scenario
from occurring.
This distinction is critical. Previous analyses of the catastrophist
heat problem---including those by sympathetic researchers---calculated
frictional heat generation under dry-boundary assumptions while
simultaneously proposing that the planet was covered in water. They set
up the problem without allowing their own model's conditions to
influence the physics.
Heat absorption by the ocean:
The ocean's thermal mass provides an enormous energy buffer.
Order-of-magnitude analysis (Appendix A) indicates that the mixed-layer
thermal buffer alone---the top 1,000 meters of catastrophically churned
ocean---is sufficient to absorb the full tectonic heat output under
wet-friction conditions without surface temperatures exceeding 40°C.
Heat transport to space:
Even though the thermal buffer alone appears sufficient, two additional
mechanisms operate continuously. First, evaporative cooling: water
contacting superheated crust absorbs 2,260 joules per gram via heat of
vaporization---the energy required to convert liquid water to steam at
the same temperature. The resulting steam rises convectively, carrying
thermal energy upward. At altitude, condensation releases this energy as
latent heat, which radiates to space. The Stefan-Boltzmann law governs
this radiation: output is proportional to the fourth power of absolute
temperature. A modest increase in upper atmospheric temperature produces
an enormous increase in radiation to space. This creates a
self-governing negative feedback loop---the hotter the surface becomes,
the more aggressively the system works to cool it.
Second, volcanic ash and particulates block incoming solar radiation
during the event, preventing additional radiant energy from being added
to the system during the period of maximum heat generation.
The self-consistent system:
Water performs four simultaneous roles in this model: it lubricates
fault zones (reducing heat generation by approximately 85%), it absorbs
heat via thermal mass (buffering the ocean against temperature spikes),
it transports heat from the surface to the upper atmosphere (via the
evaporation-condensation cycle), and it radiates that heat to space (via
the T⁴ relationship). One substance, four mechanisms, all intrinsic to
the conditions of the event itself. The cooling system is not bolted
onto the catastrophe---it is an unavoidable consequence of it.
What this resolves:
The heat dissipation problem for rapid plate tectonics.
Order-of-magnitude analysis (Appendix A) indicates that the mixed-layer
thermal buffer alone---the top 1,000 meters of catastrophically churned
ocean---can absorb the full wet-friction tectonic heat output while
keeping surface temperatures below 40°C, with a margin of approximately
1.8 times. The evaporative and radiative mechanisms operate
simultaneously on top of that buffer, providing additional cooling
capacity that the model does not require but benefits from. The claim is
not that this definitively works, but that the physics does not rule it
out---and that the mechanism is self-consistent rather than ad hoc.
Proposition 6: The post-catastrophe environment inevitably produced an ice age.
This is not a separate proposition so much as an unavoidable physical
consequence of the preceding ones. It is included because it constitutes
a successful secondary explanation---a result the model generates
without being designed to.
Post-catastrophe conditions: warm oceans (heated by absorbed tectonic
energy), cold landmasses (ash-darkened skies, reduced solar input, no
pre-catastrophe humidity layer), and sharp temperature gradients that
did not exist before the event. Warm oceans drive extreme evaporation.
Cold continents cause precipitation to fall as snow that does not melt.
It accumulates.
This is precisely the combination that conventional ice age theory
struggles to produce. Cold climates reduce evaporation, which reduces
snowfall, which limits ice sheet growth---a self-limiting cycle. The
catastrophist model produces the exact conditions required---massive
evaporation from warm oceans plus cold continental deposition
surfaces---as an automatic byproduct of the event, not as a separate
mechanism requiring its own explanation.
As the oceans gradually cool and the atmosphere clears, the ice age ends
naturally and progressively.
Reconciliation with the Ice Core Record
The ice core record is some of the hardest physical data in the
geosciences and must be accounted for rather than ignored. The Greenland
column (GISP2/GRIP) is roughly 3,000 meters of real ice. It contains
visible layering, isotopic variation (δ¹⁸O) that tracks temperature
changes, trapped gas bubbles, and volcanic ash horizons. None of that is
in dispute. The ice exists and contains what it contains.
The question is whether the timescale assigned to the column---roughly
110,000 years for the full depth---is the only reading consistent with
the physical evidence, or whether it depends on assumptions that have
degrees of freedom.
The upper portion of the column---roughly the top 2,000 to 3,000
years---is well-anchored. Layer counting in this zone is verified
against known volcanic eruptions with documented historical dates. Those
layers are annual. That is hard data and this framework does not
challenge it.
Below that depth, layers thin, compress, and become increasingly
ambiguous to resolve. The chronology shifts from direct counting to
modeling---ice flow models that assume accumulation rates, combined with
matching isotopic patterns to orbital forcing cycles (Milankovitch). The
110,000-year date at the base of the column depends on these modeling
assumptions, particularly the assumption that accumulation rates have
been roughly stable or predictably varying over the full column.
The post-catastrophe mechanism described in Proposition 6 predicts
precisely the conditions that would violate that assumption. Warm
oceans---heated by absorbed tectonic energy---evaporate aggressively.
Cold continents cause that moisture to fall as snow that does not melt.
Modern Greenland accumulates roughly 20 to 60 centimeters of ice
equivalent per year depending on location. If warm post-catastrophe
oceans drove precipitation at 5 to 10 times modern rates for the first
several centuries---which is physically reasonable given ocean
temperatures elevated by the energy budget described in Proposition
5---that produces 1 to 6 meters per year of ice equivalent. Over 500
years of elevated accumulation tapering gradually to modern rates, the
full 3,000-meter column is within reach. Michael Oard, a meteorologist
working within a catastrophist framework, has published detailed
modeling suggesting ice sheet buildup in roughly 700 years under
post-catastrophe ocean conditions.
Under these conditions, the layering in the deep column resolves
naturally. In an environment with extreme precipitation and frequent
storm cycles, multiple visible layers form per year---each major storm
deposits a distinct layer. In the upper column, where accumulation has
been at modern rates and is verified by historical markers, each layer
genuinely is annual. In the deep column, where accumulation was far more
rapid, what appears to be annual layering may be sub-annual storm
banding compressed by flow and pressure. The layer count overestimates
for the same structural reason the molecular clock overestimates in the
companion paper: it assumes a constant rate where the actual rate was
much higher early on.
The isotopic variation (δ¹⁸O) through the column shows real climate
change. In this framework, it records the rapid cooling from
post-catastrophe warm-ocean conditions to modern temperatures,
compressed into centuries rather than stretched across 110,000 years.
The signal is genuine. The timescale assigned to it is model-dependent.
This reading of the ice core record is consistent with the framework's
pre-catastrophe climate model. Proposition 4 describes a warm planet
with a substantially reduced pole-to-equator temperature gradient. This
does not preclude all high-latitude ice---some seasonal ice or modest
highland glaciation is compatible with a temperate Arctic that supports
the forest ecosystems found at Devon Island. But it does preclude
continental-scale ice sheets, which require the extreme temperature
gradients produced by modern topography. The bulk of the Greenland
column is post-catastrophe ice, built by the warm-ocean precipitation
mechanism of Proposition 6. This preserves Proposition 3's water budget
(no significant ice volume locked up pre-catastrophe), strengthens
Proposition 6 (which now predicts not just why an ice age occurred but
how much ice and how fast), and accounts for the ice core's physical
contents without requiring any of its data to be wrong.
An important constraint remains. Volcanic tephra layers in the deep
column---such as the Saksunarvatn ash and the Vedde Ash---appear at
depths that are consistent with the layer-counted chronology. If those
layers were sub-annual storm bands, the tephra positions would be
displaced relative to the layer count. This is the strongest objection
to the compressed reading. However, the apparent independence of the
tephra dating warrants scrutiny. Most tephra markers in the deep column
are dated by radiocarbon dating of associated material or by correlation
to the ice core chronology or other radiometrically calibrated reference
records---so their apparent independence is model-dependent in the same
way the accumulation-rate assumption is. A detailed examination of which
tephra markers have genuinely independent age constraints (such as
historical eruption records or dendrochronology anchored to living
trees) versus which are dated by methods that share calibration ancestry
with the ice core chronology would substantially clarify this question.
That work is a natural next step and is explicitly invited.
What this resolves:
The apparent conflict between a compressed timeline and the depth of the
Greenland ice column. The ice is real. The layers are real. The
chemistry is real. The timescale is an inference from a rate assumption,
and that rate assumption is exactly what the framework challenges---from
a specific, physically grounded mechanism rather than from hand-waving.
4. Summary of Resolved Anomalies
The six propositions, taken together, resolve the following problems
from a single causal framework:
1. How a European-lineage rhino reached the Canadian Arctic
(connected landmass, no ocean crossing required).
2. Why temperate forests existed at 75°N latitude (substantially
reduced pole-to-equator temperature gradient via unobstructed
circulation on a low-relief planet, with a supplementary greenhouse
contribution from elevated atmospheric humidity).
3. Why proteins survived to the present in tooth enamel (the
specimen is far younger than assigned; preservation is unremarkable at a
compressed age).
4. Why radiometric dates on known-age volcanic samples consistently
overestimate (catastrophic volcanism guarantees excess daughter products
in formation environments).
5. How global inundation is possible without additional water volume
(low pre-catastrophe topographic relief).
6. How rapid plate movement avoids sterilizing the surface (water as
simultaneous lubricant, thermal buffer, and convective heat
engine---intrinsic to the event, not added to it).
7. What caused the ice age and why conventional models cannot
produce sufficient precipitation to build continental ice sheets (warm
oceans plus cold continents as automatic byproduct of the catastrophe).
8. Why the fossil record contains both broad hydraulic sorting
patterns and fine biostratigraphic zonation (the catastrophe provides
the broad sorting; pre-existing ecology, carried through the event,
provides the fine structure).
9. Why the Greenland ice core column is 3,000 meters deep despite a
compressed timeline (post-catastrophe warm oceans drove extreme
precipitation onto cold continents, building the column in centuries at
accumulation rates 5 to 10 times modern values, with sub-annual storm
banding producing the apparent deep-column layering).
In engineering and scientific methodology, when a single framework
resolves multiple independent problems simultaneously---particularly
when it generates explanations for problems it was not designed to
address (such as the ice age, the biostratigraphic fine structure, and
the ice core column depth)---this is generally regarded as a strong
indicator that the framework has identified a real underlying mechanism
rather than producing ad hoc patches.
5. What This Paper Does Not Claim
This paper does not claim to have proven any of its propositions. Each
is clearly labeled as a postulate, and the reasoning that follows from
each is presented as conditional logic: if this, then that.
This paper does not claim that conventional geology is fraudulent or
that its practitioners are dishonest. It observes that the incentive
structures of institutional science make certain questions structurally
difficult to pursue, and that this is a sociological observation, not an
accusation.
This paper does not claim that radiometric physics is wrong. It claims
that the application of radiometric methods to samples with unknown
initial conditions produces results whose accuracy cannot be
verified---and that the one domain where verification is possible
(known-age volcanic samples) shows systematic overestimation.
This paper does not claim that the fossil column was produced entirely
by a single hydraulic event. It claims that the broad sorting patterns
are consistent with catastrophic deposition, while the fine
biostratigraphic structure reflects pre-existing ecological communities
deposited and organized before the catastrophe and largely preserved
through it.
This paper does not claim that the ice core data is wrong. The ice is
real, the layers are real, and the chemistry is real. It claims that the
timescale assigned to the deep column depends on accumulation rate
assumptions that are model-dependent---and that the post-catastrophe
warm-ocean mechanism predicts accumulation rates far higher than modern
values during the first centuries after the event, which would compress
the apparent chronology without requiring any of the physical data to be
discarded. The reading offered here is preliminary and would benefit
from detailed accumulation modeling.
This paper does not claim that every parameter in the energy budget is
precisely known. It claims that order-of-magnitude analysis places the
model within the plausible zone---that the physics does not rule it out.
A full computational model would be required to narrow the ranges, and
the authors welcome the attempt.
This paper does not claim that additional water beyond the existing
ocean volume is required. The inundation mechanism is topographic, not
volumetric. Existing ocean volume (~1.335 × 10⁹ km³) distributed over
a topographically smoothed Earth yields a global depth of approximately
2.6 km (8,500 feet).
This paper does not claim to have quantified the protein preservation
constraint with precision. Enamel protein survival at a compressed age
of 5,000 to 10,000 years under Arctic burial conditions is consistent
with published degradation kinetics, but formal modeling using measured
hydrolysis rates at estimated burial temperatures has not been performed
here. Such modeling is straightforward and would strengthen or narrow
the constraint. It is explicitly invited.
This paper does not claim to have addressed every proxy record that
carries a conventional chronology. Marine sediment cores, speleothems
(cave deposits), and lake varve sequences all contain layered records
with age models derived from sedimentation rates, growth rates, or
radiometric calibration. The compressed-timeline framework predicts that
these records would show similar rate-assumption vulnerabilities to
those identified in the ice core discussion---periods of elevated
deposition rate producing more layers per unit time than conventional
models assume. A systematic examination of these parallel proxy records
against the framework's predictions is a natural extension of this work.
This paper does not claim to have identified an independent observable
signature for the catastrophic trigger. The slab-detachment mechanism
described in Proposition 5 is physically plausible and consistent with
the energy budget, but the paper has not specified a geochemical,
stratigraphic, or geophysical marker that would distinguish a
catastrophic slab-foundering event from ordinary Holocene geological
variability. Identifying such markers---for example, a global pulse of
dehydration-derived fluids in mantle-sourced volcanic products, or a
contemporaneous worldwide spike in seismicity indicators---would provide
independent support for the model and is a priority for further
investigation.
6. The Open Question
The model presented here, if taken seriously, describes an event that
eliminates every terrestrial habitat on Earth simultaneously. Global
inundation, tectonic upheaval, volcanism, and atmospheric disruption
leave no viable land surface for an extended period.
Yet here we are. And so are the wolves, the horses, the cattle, and
everything else that breathes air and walks on land. If such a
catastrophe ended the world the rhino lived in, then every
land-dwelling, air-breathing animal alive at the time suffered the same
fate. The post-catastrophe world requires a survival mechanism. The
physical constraints on such a mechanism are narrow: it must be buoyant,
enclosed, provisioned for the duration of the event, and sufficient to
reestablish terrestrial biodiversity afterward.
The warm post-catastrophe ocean means the thermal environment on the
water's surface would have been far more hospitable than the land for an
extended period. Survival on the water is not the difficulty. The
difficulty is getting there with the right cargo.
And if the animals survived --- if they came through the event and
started over on a newly exposed, post-catastrophe landscape --- then
every species alive today descends from whatever walked off that vessel
and into a changed world. The pressing question is not whether it
happened. The question is: when did the wolves start howling? How fast
did a handful of founding populations diversify into the tens of
thousands of species we see today? And how many founding kinds of
animals does it take to account for all of them?
The author leaves the implications to the reader. But the questions do
not leave the reader alone.
The rhino did not cross the sea. The sea, in anything like its present
width and depth, was not yet there to cross. Everything else follows.
Appendix A: Order-of-Magnitude Energy Budget
The following analysis estimates whether the heat generated by rapid
plate tectonics can be managed by the cooling mechanisms described in
Proposition 5. All values are order-of-magnitude estimates with stated
assumptions. The goal is to determine plausibility, not precision.
A.1 Tectonic Heat Generation
Parameter Value
Frictional boundary length 40,000 km
Effective shear depth (brittle 30 km
zone)
Contact area 1.20 × 10¹² m²
Total plate displacement 5,000 km
Simultaneous engagement factor 30%
Frictional heat at plate boundaries is the primary energy source. The
calculation depends on four parameters: boundary length, shear depth,
shear stress, and total plate displacement.
Shear stress is the critical variable. Laboratory measurements of rock
friction yield the following:
Condition Shear Stress Total Heat
Dry rock friction ~100 MPa 1.80 × 1026 J
Water-lubricated faults ~15 MPa 2.70 × 1025 J
Water at fault zones reduces frictional heat generation by approximately
85%. Under conditions of global inundation, water is necessarily present
at all active boundaries. Additionally, subducting slabs release
gravitational potential energy as they sink, partially driving plate
motion and further reducing the net frictional energy budget. The
wet-friction estimate of 2.70 × 1025 joules is used as the working
figure.
Boundary friction is not the only heat source. New oceanic crust
formation during rapid plate separation releases substantial additional
energy. The total thermal inventory of new crust---latent heat of
solidification plus sensible heat from magma cooling---is approximately
6.5 × 1027 J. However, the rate at which this heat enters the ocean is
limited by thermal conduction through solid basalt. Using basalt's
thermal diffusivity of ~10−6 m²/s, the thermal penetration depth in
one year is approximately √(10−6 × 3.15 × 107) ≈ 5.6 meters, so the
ocean sees approximately 0.08% of the total crust inventory during the
event year---roughly 5.2 × 1024 J. Hydrothermal convection---water
circulating through fractured crust---delivers additional heat as
pressurized hot water directly into the ocean buffer, not as atmospheric
steam. The remaining 99.92% enters the ocean over centuries, providing
the warm post-catastrophe ocean that drives the ice age described in
Proposition 6.
A.2 Ocean Thermal Buffer
Parameter Value
Total ocean mass 1.40 × 10²¹ kg
Specific heat capacity 4,180 J/kg·K
Ocean surface area 3.60 × 10¹⁴ m²
Catastrophic mixing depth 1,000 m
Mixed layer mass 3.69 × 10²⁰ kg
Allowable temperature rise 20°C (from 20°C to 40°C)
Absorption capacity of the mixed layer at 20°C rise: 3.08 × 1025
joules. This exceeds the wet-friction tectonic heat estimate of 2.70 ×
1025 joules. The ocean's thermal buffer alone is sufficient to absorb
the full tectonic heat output without surface temperatures exceeding
40°C.
If the full ocean depth participates in mixing, the buffer capacity
rises to 1.17 × 1026 joules---more than four times the tectonic heat
under wet-friction conditions, and sufficient to manage even the
dry-friction worst case.
A.3 Evaporative Heat Removal
Evaporative cooling provides an additional heat removal pathway. The
heat of vaporization of water is 2,260 J/g (2.26 × 10⁶ J/kg). Each gram
of water that vaporizes on contact with heated surfaces removes 2,260
joules of thermal energy.
Evaporation Rate (mm/day) Energy Removed/Year
Scenario
Normal tropical 8 2.38 × 1024 J
Elevated (warm, no 15 4.45 × 1024 J
ice caps)
Storm-like 30 8.91 × 1024 J
sustained
Catastrophic 50 1.48 × 1025 J
average
Extreme (near plate 150 4.45 × 1025 J
boundaries)
At catastrophic average evaporation rates (50 mm/day over the full ocean
surface), evaporative cooling alone could remove the total wet-friction
tectonic heat in approximately 22 months. This mechanism operates
simultaneously with---not instead of---the ocean's thermal buffer.
Under the volcanic aerosol blanket and cold upper atmosphere described
in Proposition 5, the lower-atmosphere vapor-pressure gradient is
reduced by rapid low-altitude condensation and continuous precipitation.
This regime likely suppresses peak evaporation rates relative to a
clear-sky warm-ocean case. The 50 mm/day global average therefore
represents an upper-bound estimate; actual rates may be lower, but the
mechanism still operates simultaneously with the ocean buffer and
contributes meaningful margin.
A.4 Radiative Cooling to Space
Eff. Radiating Temp Output (W/m²) Energy/Year
(global)
255 K (current) 240 3.86 × 1024 J
270 K 302 4.86 × 1024 J
290 K 401 6.45 × 1024 J
310 K 524 8.43 × 1024 J
The Stefan-Boltzmann law governs thermal radiation: power output is
proportional to T⁴. The Earth currently radiates at an effective
temperature of approximately 255 K (~240 W/m²). Latent heat released at
altitude by condensing steam increases the effective radiating
temperature.
An increase in effective radiating temperature from 255 K to 290 K
produces approximately 2.60 × 1024 additional joules of radiation to
space per year. This is a supplementary mechanism, not the primary one,
but it scales aggressively with temperature due to the T⁴ relationship.
A.5 Combined Budget
Component Energy
HEAT IN: Tectonic friction 2.70 × 1025 J total
(wet)
HEAT IN: Conduction-limited crust ~5.2 × 1024 J
heat
HEAT OUT: Ocean buffer (one-time, 3.08 × 1025 J
20°C rise)
HEAT OUT: Evaporation (50 mm/day, 1.48 × 1025 J/yr
per year)
HEAT OUT: Excess radiation (per 2.60 × 1024 J/yr
year)
TOTAL OUT, Year 1 4.83 × 1025 J
Year 1 combined cooling capacity (4.83 × 1025 J) exceeds total heat
input (3.22 × 1025 J, including conduction-limited crust heat) by a
factor of approximately 1.5. The ocean buffer alone (3.08 × 1025 J) is
within ~4% of total heat input, so the supplementary evaporative and
radiative terms provide the necessary margin. The 40°C volume-weighted
average surface temperature is therefore maintained with modest but real
dependence on these additional mechanisms.
A.6 Sensitivity
The single most consequential variable in this analysis is the presence
of water at plate boundaries. The difference between dry-friction and
wet-friction heat generation is a factor of approximately 7. Under dry
conditions (1.80 × 1026 J), the ocean's mixed-layer buffer is
insufficient and the model requires full-ocean mixing to remain viable.
Under wet conditions, the mixed layer alone suffices with margin.
The model's self-consistency is worth noting: the same global inundation
that defines the catastrophe guarantees the presence of water at plate
boundaries, which simultaneously reduces heat generation and increases
heat removal capacity. The cooling mechanism is not an independent
assumption---it is a necessary consequence of the catastrophe's own
conditions.
Local temperatures near active plate boundaries would far exceed 40°C,
with explosive steam generation and localized boiling. The 40°C figure
represents the volume-weighted average of the 1,000-meter mixed layer,
not a local maximum. The ark does not need the global average---it needs
one survivable region of ocean away from the 0.3% of ocean surface that
overlies active plate boundaries.
Hydrothermal convection at mid-ocean ridges delivers the majority of
crust heat as pressurized hot water directly into the ocean buffer via
liquid-phase mixing. This is the observed mechanism at modern ridges and
bypasses the atmosphere entirely, reducing the atmospheric steam load
relative to a naive surface-contact model. At the extreme spreading
rates required by the model, fracture permeability and turbulent mixing
would be far more vigorous than at modern ridges; however, the dominant
heat transfer mechanism remains liquid-phase hydrothermal circulation
rather than direct steam release to the atmosphere.
The volcanic aerosol blanket described in Proposition 5 creates a
fundamentally different atmospheric regime from a clear-sky warm ocean.
Cold upper atmosphere over warm ocean drives violent convection, rapid
low-altitude condensation, and continuous heavy precipitation that
clears water vapor from the lower atmosphere faster than it can
accumulate. Vapor residence time drops from the current ~9 days to
~1--2 days under these conditions. The survivability concern shifts
from heat stroke to hypothermia and violent seas---conditions that are
dangerous but not thermodynamically lethal.
A.7 Limitations
Every parameter in this analysis carries substantial uncertainty. Plate
displacement, boundary engagement, shear stress at depth, mixing depth,
and evaporation rates are all estimated rather than measured. The
analysis establishes that the model occupies the plausible zone---that
the relevant quantities are of the same order of magnitude---not that
the budget balances precisely. A full computational fluid dynamics and
thermodynamic model would be required to narrow these ranges. The
authors welcome the attempt.
The energy budget presented is a lower bound. New crust formation,
latent heat of solidification, and lithospheric cooling contribute
additional heat beyond boundary friction. The conduction-rate analysis
and hydrothermal observations indicate this additional heat enters the
ocean on a timescale much longer than the event year, but a full
accounting would require computational modeling beyond the scope of this
order-of-magnitude analysis.
In particular, a full three-dimensional coupled
ocean--atmosphere--aerosol model under catastrophic plate-tectonic
conditions would be required to confirm the wet-bulb temperatures,
precipitation rates, and local habitability zones in the
volcanic-aerosol regime.