Dating Capstone – Part 4
Three anomalies in one fossil, resolved. Then the limits, set out at greater length than most papers spend on their own weaknesses.
Part 4 — Resolution and Limits
The argument is finished. What remains is to say what it amounts to.
Section 10 returns to the rhinoceros and settles its three problems against the timeline the preceding parts built. Section 11 states what the work establishes, which is less than proof and more than suggestion. Section 12 states what it does not claim, at greater length than most papers spend on their own weaknesses — because a framework this size is worth more to a reader with its limits marked than without them.
The order is deliberate. The resolution comes first because it is what the project set out to do. The claims come last because they are the part that has to survive contact with people who disagree.
10. The Rhino Resolution
The rhinoceros that started this project had three problems. A European lineage in the Canadian Arctic with no viable route across the Atlantic. A temperate forest ecosystem at 75°N latitude. And endogenous enamel proteins at a conventional age that exceeds the previous limit of phylogenetically informative molecular survival by an order of magnitude.
Across the work of this series, all three resolve simultaneously.
The lineage. The problem the specimen poses — a European lineage in the Canadian Arctic with no viable route across the Atlantic — assumes the Atlantic. Under the unified timeline there was not one when the animal lived. The landmass was single, what became Europe and what became Arctic Canada were contiguous, and a fauna shared between them is the expected condition rather than a dispersal puzzle. No crossing has to be explained, and the land bridge its describers held open for twenty million years past the prior consensus is required only by a framework in which the water is already there.
The animal died before the event or during it. The specification has the failure killing the land animals that breathed through their nostrils, so no later placement is available. Which of the two it was is not determined by anything published, and the account does not need it to be.
The Mid-Atlantic Ridge is not a boundary that has been spreading slowly for 180 million years; it is the scar of that failure. While the basins were opening they held molten basalt and flooding seawater rather than ocean. Water reaching that position from the Pacific side had crossed a continent by the time it arrived and was sheet flood rather than wave, which does not carry a carcass far; the skeleton's completeness says the same thing, since long transport disarticulates and this animal is nearly whole. He lived near where he was buried. What the model adds is that the block carrying those sediments then moved — so the distance between where he lived and where the specimen now sits was put there afterward, by the separation, not by the water.
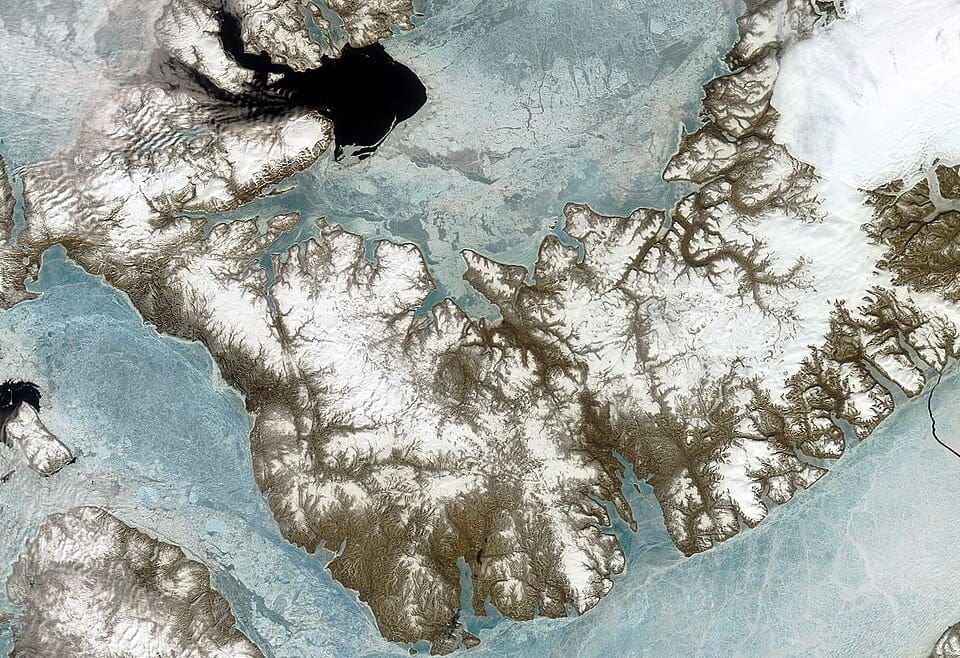
The ecosystem. Under the unified timeline, the Arctic was not always frozen. Polar ice is a post-event product: the moisture engine of the new rifts, once those basins exist and the thermal gradient is steep, can feed high-latitude accumulation (Paper 5; the onset timing is indicative, not a hard date). Before that engine, high-latitude temperatures were moderated by the absence of permanent ice caps and by a world that had not yet been split into a hot-rift / cool-remnant ocean. A temperate forest at 75°N is not an anomaly requiring a special paleoclimate model. It is the expected pre-glacial condition at high latitudes in that world. A quantified paleotemperature field for Devon Island is not claimed.
The proteins. Under the unified timeline, the rhino is not 23 million years old. It is thousands of years old — buried rapidly under conditions that later passed into permafrost as the post-event ice age developed. Protein survival at this timescale requires no special preservation mechanism. Enamel-protein hydrolysis under cold burial conditions is slow enough that survival over thousands of years falls well within ordinary ranges — the reverse of the conventional problem, where survival must be explained across millions. The twenty-three-million-year conventional age was always the anomaly that required explanation, not the protein itself. That age is not a measurement of the animal. It is inherited from the dating of the impact structure and treated by the describing authors as a maximum, with the fossils themselves placed biostratigraphically (Fraser et al. 2025). The crater is a container: the fossil beds are lake sediments that accumulated in it afterward, so the crater arrived when it arrived and the animal arrived when he arrived, and nothing in this resolution requires the crater's own date to be wrong. What compresses is the absolute scale assigned to the biostratigraphic placement — the relative order it records is preserved, as Section 4 develops.
There is a further test. The preserved proteins in the rhino's tooth enamel contain organic carbon — carbon that was part of a living animal and incorporated the atmospheric ¹⁴C/¹²C ratio at the time the enamel formed. Under the conventional twenty-three-million-year age, that carbon should contain no detectable radiocarbon. Under the model's timeline, it should.
The apparent radiocarbon age of the specimen cannot be predicted to a single number, because it depends on when the animal lived and died relative to the catastrophe. The burial context — a temperate forest assemblage at 75°N latitude, preserved in crater lake sediments now locked in permafrost — places the animal in the pre-glacial world, before polar ice locked the Arctic. Whether the rhino died before the catastrophe or during its early phases before polar cooling set in cannot be determined from the published sedimentological data alone. If the animal died before the catastrophe, when the atmospheric ¹⁴C/¹²C ratio was near modern levels, the apparent radiocarbon age should be close to the true elapsed time — roughly 4,700 to 7,200 years. If it died during the catastrophe, when the atmosphere was flooded with ¹⁴C-dead carbon from mantle degassing and ocean overturn, the apparent age would be inflated — potentially into the tens of thousands of years — because the organism incorporated a depleted ratio that the method interprets as greater elapsed time.
In either case, the prediction is the same: detectable radiocarbon. Not zero. The conventional framework predicts zero. The model predicts a signal. One measurement on one specimen that is already in a museum collection, with organic carbon already confirmed present. The rhino that started this project could deliver the most direct single test of the framework that resolves it. The two branches also discriminate between themselves: an apparent age near the elapsed window places the animal before the event, an inflated one places him in it. Nothing published settles that question, and a single measurement would.
Three anomalies. Three resolutions. None of them was designed to explain the rhino. The date came from the mutational load clock, out of published genetic data. Polar ice follows from the rift moisture engine. The recalibration framework was developed from known-age test failures. The rhino's three problems resolve because the timeline that nineteen mutually constraining lines of evidence are built around happens to be a timeline where a European rhinoceros at 75°N latitude with endogenous proteins in its teeth makes sense.
The rhino was never the proof. It was the question. The proof — to the extent that coherence across independently sourced evidence constitutes proof — is the nineteen lines laid out in Section 3, the recalibration framework of Section 4, and the twenty-one tests of Section 9 that specify exactly how to break it.
Paper 1 opened with a fossil that did not fit. This paper closes with a framework where it does — not because the framework was built around the fossil, but because the fossil was the first clue that the framework might be needed.
The anomaly was never the rhinoceros. The anomaly was the assumption.
11. What This Paper Establishes
This project began with a rhinoceros that did not fit the conventional framework and asked whether the framework itself might be the problem. Across the series that followed, the answer has not been a claim of certainty. It is a body of evidence and an invitation to test it.
The date — a window of 4,725 to 7,200 years, centrally 5,786, returned by Paper 11 from a measured private mutational load divided by a measured germline mutation rate — anchors a unified post-event chronology, and a velocity history exists that can finish inside that window against the measured Atlantic displacement (Section 3). Nineteen lines across seven disciplines are consistent with that chronology. They are not nineteen independent measurements of it: one measures the date and the rest are constrained by it, a structure set out in the inventory of Section 3. It was built one series at a time.
Radiometric dating methods are not rejected. The physics of radioactive decay is precise and undisputed. The vulnerability is in the initial conditions assumed at the time of formation — assumptions that fail empirically on systems of known age, in both radiometric and molecular clock methods, consistently in the same direction: too old. The recalibration framework identifies the specific non-uniformitarian conditions the catastrophe model specifies for a defined post-event window, states the expected direction of the bias for each method, and preserves the stratigraphic sequence that two centuries of fieldwork established. Full compression curves are future work, not results claimed here. The absolute scale changes. The relative order does not.
What remains unfinished is not reasoning but computation. Four full-scale models — a geodynamo simulation, a coupled climate model, an ice-sheet model, and a three-dimensional tectonic model — would carry the assessment past the limit reduced-order analysis can reach, and are specified as hand-offs (Section 8) rather than executed here. Separately, two categories of evidence fall out of the compressed timeline without any special development: soft-tissue preservation and ancient-DNA survival in material conventionally dated to millions of years, which at a few thousand years require no exceptional preservation. These are noted, not pressed.
Five modern observables — the ocean floor's own residual formation heat, geomagnetic secular variation, Himalayan rebound, Patagonian glacial isostatic adjustment, and residual radiocarbon in ancient carbon reservoirs — show present-day measurements consistent with the damped tail of a system still settling from a perturbation inside the window. The rates are measured, not predicted; the model does not claim a fitted relaxation timescale for any of them, and each observable has a conventional explanation of its own (Section 7). What the model supplies is the reason all five should still be in motion at once. The conventional framework accounts for them as five separate processes; the catastrophe model accounts for them as one.
Twenty-one discriminating tests are proposed across seven disciplines. Each specifies what the model predicts, what the conventional framework predicts, and what measurement or analysis would distinguish between them. Some require new data. Some require new analysis of existing data. Some require only continued monitoring with the model's predictions stated in advance. Every test can produce a result that counts against the model.
The project does not ask to be believed. It asks to be tested. Every parameter is sourced. Every gap is acknowledged. Every prediction is falsifiable. The measurements are specified. The data is invited.
12. What This Paper Does Not Claim
This paper does not claim that uniformitarian radiometric dating is fundamentally broken. It claims that the input assumptions — specifically the assumed initial daughter-product concentrations and atmospheric isotope ratios — are wrong for the specific post-catastrophe window the model defines, producing systematic bias in that window only.
This paper did not investigate claims related to a young Earth. Such claims concern the pre-event timeline, which this analysis does not evaluate; the work is confined to the recent catastrophic event and its consequences, and nothing here turns on how much time preceded that event. Whether the pre-event world is old or young does not bear on whether a recent catastrophe explains the record examined here.
This paper does not claim to recalibrate every date in the geological record. The recalibration framework applies to the post-event window — from the event to the present, on the order of five to seven thousand years. Pre-event strata and fossils — material formed before the catastrophe — are not addressed by the recalibration and are not claimed to be misdated by the same mechanism.
This paper does not claim that every conventional date is wrong by the same factor. The compression is time-dependent and method-dependent. Dates closest to the event boundary are most compressed. Recent dates converge toward correct ages. The shape of each method's curve is a target, not a finished calculation.
This paper does not claim that nineteen mutually constraining lines constitute proof. It claims that coherence across independently sourced constraints is the standard scientific method for building confidence in a date — and that coherence of this kind, across this many disciplines, warrants serious engagement with the framework that produces it.
This paper does not claim a tuned or fitted timescale. The date is not a physics result at all: it comes from a variant count divided by a pedigree-measured mutation rate, with no model parameter in it and no input from the catastrophe model. The velocity history is required to finish inside that window against the measured Atlantic displacement; its early decay constant follows from the observed separation and the peak velocity the force balance produces. That is not “zero free parameters” in the sense that no physical analogy was used. The exponential form is the expected first-order behavior of a rupturing, healing shell. The date is the load clock. The two should not be conflated.
This paper does not claim to have run the full-scale models its framework calls for. Four computational efforts — a geodynamo simulation, a coupled climate model, an ice-sheet model, and a three-dimensional tectonic model — are specified as hand-offs (Section 8), not executed here. In particular, the paper does not claim a quantitative reconstruction of polar ice thickness or an event-by-event isotopic reinterpretation of the ice cores. It offers the moisture-supply budget and a front-loaded accumulation-rate curve. Chemical load in the deep ice (dust, salt, volcanic) is expected even if that ice is visually massive rather than neatly banded. Countable annual fabric at the base is not claimed; that is the ice modeler's return, not a result here. Nor does the paper contest the tree-ring and speleothem chronologies, which the analysis treats as reading true (Section 5); they are not among the open problems.
This paper does not claim that any single damped-tail observable is individually diagnostic. Each of the present-day residuals in Section 7 has a conventional explanation of its own; the argument is the pattern — several independent systems still in motion at once, each for a reason the mechanism names — not the standalone force of any one of them.
This paper does not claim that the twenty-one discriminating tests will confirm the model. It claims that they will distinguish between frameworks — and that the model specifies its predictions in advance of the measurements. If the tests break the model, the model is broken. That is how science works.
This paper does not claim that residual radiocarbon in ancient carbon reservoirs, on its own, proves the timeline. Contamination remains a legitimate competing explanation; the model's reading is distinguished from it only by the source-variation test specified in Section 9, which has not yet been run at the scale required.
This paper does not claim that the ocean-floor magnetic record was written by completed geomagnetic reversals, and it does not rely on completed reversals as a mechanism; the compressed timeline cannot supply hundreds of them, and the model does not ask it to. It does not claim that a full, lasting dipole reversal can physically complete in two to six years. What it proposes instead — a suppressed, disturbed field recorded by a fast-quenching surface — is developed in Section 6. Appendix B supplies and bounds the core-mantle-boundary supply of thermal deficit but does not model the dynamo's response or the fraction of that deficit that couples into boundary heat flux, and it does not claim the dynamo responds cleanly rather than chaotically; whether that response produces the specific record preserved in the ocean floor is specified as a test (Section 9), not claimed as a result. The forcing is supplied and bounded; the response is handed off.
This paper does not claim that robust dating methods are misdating undisturbed material. Uranium-lead and isochron methods, which solve for or bypass the initial-condition assumption, are accepted; applied to old, undisturbed crystalline rock they return its true age, which is exactly what the model expects (Section 5). The recalibration concerns the materials and conditions the event disturbed. Relatedly, the paper does not dispute that old rock exists within young deposits: catastrophic transport carries reworked older fragments into event-age layers, and a fragment's true old age is not in conflict with the young age of the deposit that holds it.
This paper does not claim that the conventional age of the ocean floor rests on faulty radiometric measurements. The seafloor age grid is a magnetic-pattern age converted to years through an assumed spreading rate; the disagreement is over that spreading-rate premise (which this model replaces), not over the magnetic measurements themselves, which are not in dispute (Section 6). Nor does the paper claim that the remnant Pacific carries the event's disturbed-field signature: that signature is specific to the new floor, and the pre-event Pacific reads its own ordinary field history (Sections 5 and 6).
This concludes the Dating Capstone and the project as a whole. The project began with a fossil that did not fit and ends with a framework that resolves it — along with nineteen mutually constraining lines of evidence, a method-by-method recalibration of the conventional chronology, the specified models that would test it further, and twenty-one tests that specify exactly how to break it. The work is public. The predictions are on the record. The data is invited.
← Part 3 · Series · Appendix A →
© 2026 D. L. White. Licensed under CC BY-ND 4.0. https://creativecommons.org/licenses/by-nd/4.0/
AI Collaboration Disclosure: Drafting and calculations by Claude (Anthropic), with adversarial review by Grok (xAI), under the direction of D. L. White. Neither AI system endorses all conclusions as settled.